Social Explorer
Overview
Social Explorer provides interactive census data visualization for the United States spanning 1940 to 2000. The free public edition allows students to visually analyze and understand the demography of the U.S., their regions, and their neighborhoods. Developed by City University of New York (CUNY), the platform enables users to create custom queries and manipulate demographic datasets through interactive maps.
Getting Started
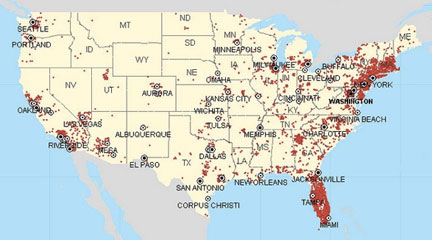
Upon initial access, users receive a guided tour introducing the platform’s core features. The default view displays U.S. population density. The interface includes controls to adjust data variables, select specific states, and choose visualization methods (shaded or dot density displays). Data is organized by thematic categories that can be filtered by year or survey type. The tool encompasses Hawaii and Alaska and allows side-by-side regional comparisons.
Example
Social Explorer’s blog showcases practical applications of the platform, including demographic analyses exploring racial demographics in the U.S. and citizenship reports offering insights into voting-age population patterns across the nation.