BROWSE BY CATEGORY
- Archives and Libraries
- Blogs and Networking
- Bookmark This
- Digital Tools
- Examples of Teaching
- Exhibits
- Film Reviews
- History and Headlines
- Historic Sites and Museums
- Historical Thinking
- Holidays and Heritage
- Issues and Research
- Lesson Plans
- Material and Visual Culture
- Multimedia
- Organizations and Agencies
- Primary Sources
- Professional Development
- Publications
- Student Activities
- Teaching Materials
- Websites
Jennifer Orr on Data Retrieval Charts

Young children take in ideas at an astounding rate. Because so much is new to them they have to process and make sense of much more than adults do. It is critical, therefore, that we help students with this process. Data retrieval charts offer a way to visually show the organization of and connections between information. This makes it easier for students to make sense of and more deeply understand what they are learning.
Data retrieval charts are exactly what the name suggests: a chart for data. I have used them frequently with my first graders because they are a wonderful visual tool for understanding concepts that are new or challenging.
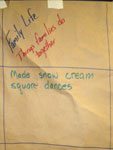
At the beginning of first grade we explore the idea of past and present. Six year olds struggle with comprehending anything that happened before they were born. So we look at past and present through four areas: school, family life, community, and transportation; all ideas with which young children have some experience. The chart has those topics across the top with two rows below them, one for past and one for present. As we read books, look at images, watch videos, interview people, or gather data in any other way we add it to our chart. We add words, phrases, sentences, and pictures.
One positive characteristic of a data retrieval chart is its visual nature. It hangs in our room throughout our study of past and present and often beyond it. That way students see it often, can add to it whenever we want, and can use it to help us understand the rest of our social studies curriculum. Therein lies the retrieval piece of a data retrieval chart.

We also study several famous Americans during the year: Ben Franklin, George Washington, Abraham Lincoln, and George Washington Carver. The curricular expectation is that students will understand the contributions made to our country by these men. Our data retrieval chart for this study has the names of the men down one side with several categories across the top: date of birth and death (with a timeline along the bottom to support their understanding of when each man lived), contributions, and interesting facts. I include interesting facts because my students inevitably learn things about these men that are not really contributions but that fascinate them. Some years my students have requested other columns added to fit their interests, such as one about family or childhood.
Students often return to our data retrieval charts as we learn new things about American history. They might notice new connections or find themselves asking questions about how certain information relates to what they are learning now. They also often look back at our charts during writing. They enjoy writing about things they are learning and the data retrieval charts help them recall information and synthesize their thinking.
For more information
Graphic organizers like data retrieval charts help students collect, connect, and visualize information. Pick up more tips and tricks for using graphic organizers in Ask a Master Teacher, see them in use in Teaching in Action, and learn scaffolding hints for diverse learners in Teaching English Language Learners.
