At a Glance
What is it?
Website
Social Explorer
Social Explorer provides easy access to census demographics about the United States from 1940 to 2000. The free public edition offers a collection of interactive demographic maps of census data that can be viewed, queried, and manipulated. Students can visually analyze and understand the demography of the U.S., their regions, and their neighborhoods, creating their own queries and parameters.
Tools include zoom-in capability, selection of variables, the option to create a slideshow enabling comparative dataset mapping, and printing. City University of New York (CUNY) developed the project.
Getting Started
When you first access the site you will be offered a tour to get a feel of the tools offered and learn how to filter and display data. Even after the tour is complete, should you need assistance you can always re-open it on the top navigation bar.
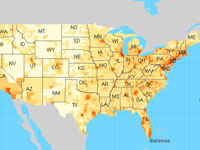
Once the tour is complete, the default map will display population density in the United States. In the upper left-hand corner there is the option to change data, state, and how the results are displayed (shaded vs. dot density). Data is categorized into different themes which can be further narrowed down by year or by survey. Although the map only shows information for the United States, it does include Hawaii and Alaska and different regions can be compared side by side using the gray bubble at the bottom.
Examples
The Social Explorer blog offers several helpful examples of how the site might be used. This video explorers more about Social Explorer's tools and resources. They also offer different categories in which user submitted reports and stories are featured. Take a look at this story that explored racial demographics in the U.S. around the time of the 2018 royal wedding. This data report also offers interesting and detailed data on citizenship.