Laboring to Bring Forth Child Labor Statistics
field_image
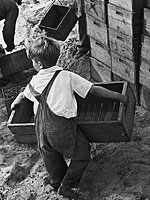
boy laborer in cranberry bog 1938
Question

How many children under 16 were employed in 1940?

Answer

The short answer is this: If you mean full-time work (with certain exceptions) ―none were employed, at least legally.

This was the result of the signing into law in 1938 (two years before) of the Fair Labor Standards Act. Wake Forest University Economics Professor Robert Whaples puts it succinctly: "the Fair Labor Standards Act of 1938 prohibited the full-time employment of those 16 and under (with a few exemptions) and enacted a national minimum wage which made employing most children uneconomical." Whaples describes the various reasons, apart from the enactment of federal, state, and local laws, why the numbers of children working in industry and on the farm had already declined dramatically over the first few decades of the 20th century before the passage of the Act.

The provision of the Fair Labor Standards Act (FLSA) that dealt with child labor stated: "No employer shall employ any oppressive child labor in commerce or in the production of goods for commerce or in any enterprise engaged in commerce or in the production of goods for commerce."

The FLSA, as further defined by statute, prohibited children under 16 from any kind of employment in certain hazardous kinds of work. The Secretary of Labor has periodically revised such categories of hazardous work. For agricultural work, for example, those under 16 should not be employed in operating a tractor of over 20 horsepower, or a hay baler, a forklift, a power post-hold digger, or a chain saw. Nor should they work in a yard or stall in which there is a bull, boar, or stud horse, a sow with suckling pigs, or a cow with newborn calf.

The FLSA also prohibits those under 18 from certain kinds of occupations altogether. These include occupations that require working with explosives or radioactive materials, operating most power-driven woodworking, baking, or meat processing machines, as well as most jobs in mining, meatpacking, logging, and brick-making.

Some Did Work

The FLSA exempts certain kinds of work, including employment of children by their parents, and church work. Boys and girls also worked (as they do today) at jobs not covered by FLSA regulations, such as office or clerical work, retail sales positions, food preparation, caring for younger children, and so on.

Given these exemptions, what was the actual number working in 1940?

Gertrude Folks Zimand, General Secretary of the National Child Labor Committee, in "The Changing Picture of Child Labor," published in 1944 in the Journal of the American Academy of Political and Social Science (pages 83-91), reported that the 1940 census showed, among 14- to 15-year-olds, a total of 4,347,665 attending school, and a total of 209,347 gainfully employed (no number was reported for children ages 7-14 who were not in school but were gainfully employed, but the number of these children attending school was 15,034,695; the numbers for 16- to 17-year-olds were 3,361,206 in school and 662,967 gainfully employed). The term "Gainfully employed" included full- and part-time work, either in industry or agriculture. There was some overlap in these numbers because some children were in school but were also working, at least part-time. But according to Zimand, 64 percent of the 14- to 15-year-olds and 83 percent of the 16- to 17-year-olds who were working were out of school and were therefore presumably working full time.

For more information

Robert Whaples. "Child Labor in the United States." EH.Net Encyclopedia, edited by Robert Whaples. October 7, 2005.

The text of the Fair Labor Standards Act of 1938, as amended.

The National Child Labor Committee website.
Child Labor Statistics at the United States Department of Labor.

Donald M. Fisk. "American Labor in the 20th Century" at the Bureau of Labor Statistics.

"Child Labor Laws and Enforcement," chapter 2 of the Report on the Youth Labor Force (revised 2000) at the Bureau of Labor Statistics. This includes a brief history of child labor in the U.S. and the legislative restrictions governing it, as well as a discussion comparing aspects of youth employment in the U.S., such as temporary or part-time teen employment, with youth employment elsewhere in the world.

The Child Labor Public Education Project's website on Child Labor in U.S. History provides links to a variety of documents on child labor.

Bibliography

Children watching a Labor Day Parade, Silverton Colorado, September 1940. Prints and Photographs Division, Library of Congress.

Detail of photo of boy laborer in cranberry bog, Burlington County, New Jersey, 1938. Prints and Photographs Division, Library of Congress.

Questioning History Using the Census Anonymous (not verified) Thu, 05/26/2011 - 17:35
Date Published
Image
Table, Census data
Table, Census data
Article Body

What can we learn about the importance of population change and industrial development in Detroit, MI? What does the Detroit story tell us about industrialization in American history? Do upsurges or downturns in the population become permanent? Or do they change direction again? Where do the people come from who determine the population changes, and where do they go? The 2010 Census and other demographic data helped me answer these questions for myself. Students can use demographic data to answer questions in similar ways.

Looking for More Information

Detroit's volatile population changes drew media attention in the spring of 2011 as the 2010 Census figures were being rolled out. I became curious about the reasons for this population change. The overall U.S. population reached 308 million in 2010, about a 10% growth rate, from 2000. Most states and major urban areas grew at a 1% per year rate. There were, however, a few areas which did not grow, but declined. One of those was Detroit.

I wanted to know more about the situation with Detroit and why people came and left at different times in its history. I looked into Detroit's population history through the once-a-decade census reports that are available from the U.S. Census Bureau, the 2010 Census website, and the University of Virginia's Historical Census Browser. The Census Bureau also published the American Community Survey in the years 2005–2009 that covers occupations, social statistics, housing, mobility, language use, country of origin, and other data. These surveys are available on Detroit's Population and Housing Narrative Profile and in its American FactFinder.

To get a feel for the demographic volatility in the history of Detroit since 1850, I examined the Census figures for each year and the percentages of increase or decrease:

Table, Census data

Comparing Interpretations

Now that I had the numbers, I looked for interpretations. An NBC analysis of Census figures attributes the Detroit population decline to "steady downsizing of the auto industry":

Detroit's population peaked at 1.8 million in 1950, when it ranked fifth nationally. But the new numbers reflect a steady downsizing of the auto industry—the city's economic lifeblood for a century—and an exodus of many residents to the suburbs. Detroit's population plunged 25% in the past decade to 713,777, the lowest count since 1910, four years before Henry Ford offered $5 a day to autoworkers, sparking a boom that quadrupled the Motor City's size in the first half of the 20th century.

This led me to ask, what did Detroit's actual population look like in earlier years? I examined some of these periods of time, using older census data. The 1950 U.S. Census found that the population of the city was 1,849,568. It had grown by over 200,000 from its 1940 population of 1,623,452. The foreign-born population was 276,000 from Canada, Poland, Italy, Germany, the USSR, England/Wales, and Scotland. The black population was 300,506. The 1910 U.S. Census revealed that the total population was 465,786. The native white population was 115,106, the black population was 85,000, and the foreign born was 156,555. The foreign born of this era came from Germany, Canada, Russia, Austria, Hungary, Ireland, and Poland.

Finally, I checked Detroit's pre-industrial censuses from 1850 to 1880 and found the area to be rural but commercially active as a Great Lakes port. It grew rapidly in these years, but had only a small fraction of the population it would later have during the rapid growth of the auto industry.

Questions Lead to Questions

Now I had another question. Where did the people who contributed to this growth come from? The Detroit News' website, detnews.com, gave me an answer in an article by Vivian Baulch entitled "Michigan's Greatest Treasure-its people." This article presents an ethnic description of Detroit from the time that it was an important stop on the Underground Railroad through the boom years of the auto industry. The article concludes with a quote by historian Arthur Woodford:

Detroit has "the largest multi-ethnic population of any city in the United States. Detroit has the largest Arabic-speaking population outside of the Middle East, the second largest Polish population in America (only Chicago has more), and the largest U.S. concentration of Belgians, Chaldeans and Maltese."

Another source is the U.S. Senate's hearings in 1908–1911 on Immigration and Industry. Known as the Dillingham Commission, the hearings' 31 volumes have been digitized by Stanford University's e-brary. Volume 8 provides an insight into Detroit's diversity as shown by the children of immigrant workers in their school settings.

Synthesizing My Findings

These population figures, when I connected them to the rapid growth and consolidation of the auto industry and the upsurge in immigration and internal migration, gave me an overview of what happened in Detroit. It showed a boom and bust cycle in industry and the apparent willingness of many people to leave the city and/or metropolitan area when economic conditions are bad. The rise and decline of the American auto industry helped me get a grip on industrialization as a major factor in population growth and decline. Other industries such as iron, steel, car parts, batteries, tires, and glass are at least partially dependent on, or tied to, the fortunes of the auto industry, and thus whatever happens to the auto industry in Detroit has an impact on the national industrial scene. Other nearby formerly industrial cities have demographics similar to Detroit's. However, the decline may not be permanent. The auto industry has begun a modest revival and may continue to grow in the near future. Detroit is still the center of this industry and may again rise to a greater position of prominence among American cities.

By exploring census and other demographic data, students can form their own historical questions and answer them by tracing quantitative and interpretative information, just as I did. Population and industry shifts can rarely be understood from one source. Ask a question and use the information you find to assemble you own answer.

Bibliography

Associated Press. "Census: Detroit's population plummets 25 percent". March 22, 2011. Accessed May 26, 2011.

Baulch, Vivian. "Michigan's Greatest Treasure-its people." Detroit News. September 4, 1999. Accessed May 26, 2011.

For more information

Intimidated by the thought of working with quantitative data (numbers)? Professor Gary Kornblith guides you through finding and interpreting such data.

If you're looking for some numbers to crunch, more than 50 websites we've reviewed feature quantitative data. Last year, our blog also suggested ideas for teaching with census data.

Family History and the 1940 Census

Date Published
Image
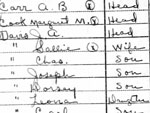
Detail, 1940 census, ED 76-1, NARA
Article Body

On April 2, 2012, the U.S. National Archives released detailed 1940 census records offering full access to 1940 census images as well as 1940 census maps and descriptions. I am enhancing my knowledge base on my family's history by using the information gathered in the April 1940 Census.

Each detailed census, released after 72 years, covers important data about most families. The release consists primarily of the actual census data sheets filled out by the enumerator or census-taker that contain information on addresses, family members, ages, sex, race, marital status, educational attainment, birthplace, and occupation. The occupation category reports on the wages earned. There is a subcategory which includes those who performed "Public Emergency Work." This subcategory chronicles the situation of over three million people who worked for such New Deal agencies as the Civilian Conservation Corps, the Works Progress Administration, and the National Youth Administration which employed unemployed people to carry out specific work projects during the depths of the Great Depression. There is also a category that directed the Enumerator to "indicate whether engaged in home housework (H), in school (S) unable to work (U), or other (Ot)."

Each detailed census, released after 72 years, covers important data about most families.

In order to find information about my grandparents and great-grandparents, I used the census maps of Enumeration Districts provided by Stephen Morse and Joel Weintraub at the Unified 1940 Census ED Finder. I started by looking for Enumeration District maps that covered the area where my family members lived. Then I searched the data sheets in each district until I found actual addresses for my relatives and could complete my search. Most people do not know their relatives' addresses and may choose to look under their names. While many companies offer research services (for a fee), the 1940 census data can be a wonderful resource for conducting your own research or learning about life in the 1940s.

The following organizations are organizing the digitized data sheets so that searches can be made by the name of the family member. Each contains some free information, as well as more complete information that requires a monthly or annual fee:

For more information

Searching census data can both answer and create questions. In an earlier blog entry, Alex Stein looks at his questions as he researched urban history.

Genealogy research projects reward students with a personal look into history. High school teacher Joe Jelen shares project ideas.

For earlier census data, try the University of Virginia's U.S. Historical Census Browser.

Beyond Numbers: A History of the U.S. Census

Description

According to Backstory:

"To mark the culmination of Census 2010, BackStory takes on the fascinating story of how Americans have counted themselves throughout our nation’s history. As it turns out, the idea of doling out power based on the actual number of people in a region was an American innovation. The History Guys explain what was so revolutionary about the concept in 1787, and explore how assumptions about who counts as an American have shifted over time. They also look at the reasons the “undercount” became such an important issue in the 20th century, and consider the ways Americans’ suspicion of government has posed a challenge to the work of the Census Bureau. Over the course of the hour, they are joined by a scholar, former Census workers, and listeners interested in exploring the invisible backbone of American democracy: the U.S. Census."

National Archives and Records Administration: Central Plains Region [MO]

Description

The Central Plains regional branch of the National Archives holds federal and court records from Kansas, Missouri, Nebraska, South Dakota, North Dakota, and Iowa. Collections include Leavenworth Penitentiary mugshots and files, World War II draft cards, naturalization records, federal land records, and records from the Bureau of Indian Affairs, among other topics.

On site, you can conduct research, take in exhibits, make rubbings of well-known signatures, and watch an 11-minute film. Prior to visiting you can arrange a facility tour (for adults or for children) and/or children's activities. Take a look at this handy .PDF file for an overview of the archives and descriptions of source types. The archives even provides a list of local restaurants to make visiting easy. Additional visit preparation resources include online finding guides for looking through a portion of the available records and a current exhibit listing.

In addition, the archives offers a calendar of free public events. Reservations are required.

Just for Students and Educators

The Central Plains archive branch emphasizes hands-on activities for students, which can be customized to meet your current curricula needs and meet either at the archives or your school. Other visit options include guided or self-guided exhibit tours, complete with pre-visit curriculum packets and information on how the exhibits related to state standards, and professional development workshops

In addition to on-site opportunities, you students can also participate in one of five interactive distance learning programs. Topics include using documents, the Civil War, history online, westward expansion, and National Archives online resources. You can also request a free annual primary source CD with documents, information on their relationship to national standards, teacher notes, suggested activities, and analysis worksheets. While you're waiting for the CD to arrive or if you are interested in looking at a sample of its contents, try teaching suggestions on industrialization and/or the Civil War or Constitution Day lesson plans.

Knock, Knock. . . Who Lives Here?

Quiz Webform ID
22414
date_published
Teaser

Would you answer the door if the census taker came knocking?

quiz_instructions

In March 2010, the 23rd U.S. census went out—220 years after the first census, in 1790. What do census questions tell us about American society and values? Look at the categories of census data below and select the year in which the information was collected.

Quiz Answer

1. 1790
families with 11 or more members
families holding 2-4 slaves
avg. slaves per slaveholding family
free colored slaveholding families
persons of Scotch nationality
persons of Hebrew nationality

2. 1840
white persons 20 years of age and over who cannot read and write
scholars in primary and common schools
female slaves 55-99 years of age
free colored females under 10 years of age
men employed in newspaper production
persons employed in navigation of canals

3. 1870
male citizens 21 years of age and over
persons born in Africa
persons 10 and over who cannot read
total state taxation
public debt of the county
youths employed in manufacturing

4. 1880
persons born in China
Indians
colored persons
farms 500-999 acres rented for fixed money rental
average hours labor per week in iron and steel manufacturing
average youths and children employed in manufacturing

5. 1900
other colored females 5-20 years of age
illiterate foreign-born alien males 21 years of age and over
native white illiterates 10 years of age and over of native parentage
farms of colored owners and tenants
capital invested in buildings used in manufacturing
salaries of salaried officials, clerks, etc. in manufacturing

6. 1910
rural population
white persons born in asian turkey
native white males of voting age of mixed parentage
Indian, Chinese, Japanese and male of all other races of voting age
persons 15-17 years of age attending school
farms of foreign-born whites

For more information

census-ctlm.jpg In 1790, federal marshals collected data for the first census, knocking by hand on each and every door. As directed by the U.S. Constitution, they counted the population based on specific criteria, including "males under 16 years, free White females, all other free persons (by sex and color), and slaves." There was no pre-printed form, however, so marshals submitted their returns, sometimes with additional information, in a variety of formats.
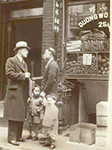
In 1810 and 1820, additional categories appeared, collecting information on "free White males and females under 10 years of age," as well as those "10 and under 16," "16 and under 26," "26 and under 45," and "45 years and upward." "Free colored persons" and slaves were now counted separately as were "all other persons, except Indians not taxed" and "foreigners not naturalized." Through the decades, the census continued to expand, including a growing number of questions on agriculture, manufacturing, living conditions, education, crime, mortality, and increasingly, race and ancestry.

The census has always had political implications, informing conscription, Congressional representation, and the collection and allocation of taxes. It has also always both reflected and shaped social divisions. Before 1960, census enumerators interviewed families in person and without consulting the individuals, selected which box to check for "race." Starting in 1960, largely for financial reasons, the Census Bureau mailed forms directly to households, thereby allowing individuals to select their own boxes. This led to a fundamental change in the way race was categorized and measured. In 2000, for the first time, individuals could select more than one box and about 6.8 million Americans did so, reflecting the complex nature of racial and ethnic categories today.

The 2010 census is designed to count all residents and will ask a small number of questions, such as name, sex, age, date of birth, race, ethnicity, relationship and housing tenure. The longer American Community Survey will collect socioeconomic data annually from a representative sample of the population.

For searchable (and map-able) databases of historical census data from 1790 to 1960, refer to the University of Virginia's United States Historical Census Data Browser. For more current information, try the official website of the U.S. Census Bureau..

Sources
Image
image census quiz
thumbnail
census quiz thumbnail
Preview Mode
On

California or Bust

Quiz Webform ID
22410
date_published
Teaser

Who went west when? Answer questions about migration from 1935 to 2000.

quiz_instructions

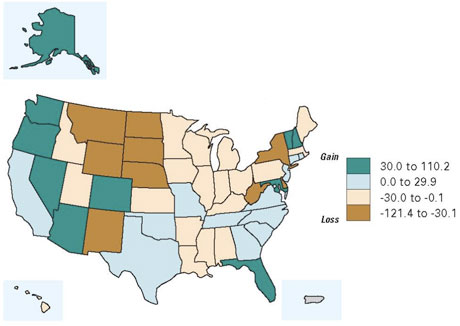
Federal Census figures demonstrate the migration of people from state to state and from region to region over the years. Below are three maps depicting the migration rate (the rate of net domestic migration per 1,000 people), each covering a five-year period. Match each map to the period it represents.

Quiz Answer


1.
b. 1965-1970


2.
a. 1935-1940


3.
c. 1995-2000

Overall, the census data describes the following pattern of migration flow between California and the other states, showing the periods 1955 to 1960 in red and 1995 to 2000 in blue:

All of these maps are from Trudy A. Suchan et al's Census Atlas of the United States (Washington, DC: U.S. Census Bureau, 2007), available online, as well as in print. Check out Chapter 7, "Migration," for further data and visualizations on migration trends.

For more information

Interested in exploring the census further in the classroom? Teachinghistory.org's Lesson Plan Review The First Census: America in 1790 leads students to examine census data for insights into the politics behind the Great Compromise and the Three Fifths Compromise at the Constitutional Convention of 1787.

Don't be turned away by its long name—the Selected Historical Decennial Census Population and Housing Counts website houses more than 21 historical census reports and the history of each U.S. census taken. The United States Census Bureau, of course, also provides a wealth of census data and tools for accessing and assessing the data. And for census data stretching from 1790 to 1960, try the University of Virginia's United States Historical Census Data Browser.

Sources
Image
quiz-census2-answer
quiz-census2-answer
quiz-census2-answer
quiz-census2-answer
thumbnail
quiz-census-migration-thumbnail
Preview Mode
On

Historic Pittsburgh [PA]

Description

Historic Pittsburgh is an online collection of local historical resources, including materials held by the University of Pittsburgh's University Library System, the Library & Archives at the Heinz History Center, the Carnegie Museum of Art, Chatham College Archives, Pittsburgh History & Landmarks Foundation, and the Point Park University Archives.

The website offers databases of maps, images, and census records. The website also offers library access to the above-mentioned libraries, general historical information, and a page for teachers detailing suggested classroom applications of the website. To contact the site via email, use the webpage: http://www.library.pitt.edu/services/aska.html.