myHistro

Image
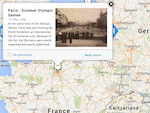
Screencapture, Olympic Games, Jala Peno, myHistro, 2013
What is it?

myHistro is a storytelling tool that allows you to place events both geographically and on a timeline to tell a story. Users create stories that can have multiple events each of which takes place in a different time and place. The tool allows you to incorporate video, images, and text to narrate the story for users as they click through.

Getting Started

To start using myHistro, click the "Sign Up" button on the homepage. Provide your name and email address and you are ready to start creating a story.

To begin creating, select "Create a New Story." Type a name, a short description, and select a thumbnail image for your story. There is also the option to list several authors for the story—useful for students who are working as a group. Clicking on the "Tags, privacy, comments" hyperlink takes you to options that allow you to tag the story with relevant keywords, control who can see the story, and control who can comment once the story is finished.

Once you've created a story you'll want to create a few (or more) events to fill the story. Clicking the green "Next" button or the grey "Add and Manage Events" bar takes you to the event creation page. Here you can create as many events as you'd like to include in your story. Clicking "Create New Event" allows you to add a new event. You can set the start and end date (optional) for the event as well as add a time. If the event doesn't have a specific day or month associated with it, you can set them as unknown and just use the year. You can also set the date manually so that it can include a prehistoric date (BC) by selecting "Set Manually" at the bottom of the drop-down list under year.

You'll also want to set a location associated with an event. The map allows you to select from several map types including Satellite, Hybrid, Terrain, and the normal Google Maps view. You can plot the location of the event using the traditional map marker or you can use the drawing tools to draw a shape or a line on the map.

Once you've added your events, finalize your story by selecting "Save story." You'll then be taken to view your story. From here you can export, embed, or comment on your story. For a more detailed orientation to the options available within myHistro, see their Slideshare entitled "History Visualization: Basic Guidelines for History Teachers.”

Examples

myHistro could be used as either a teaching and presentational tool or as a project for students. The combination of creating a timeline and narrative and placing those within a geographical location require students to practice arranging and interpreting events in both time and space. The tool is probably best used with students of middle school age or older because of the complexity of creating stories and events.

Creating a story could help students review a unit or review for an exam, either in a group or individually. In this AP United States history project, each student from the class contributed in order to create a story of important events in U.S. history from 1619 to 1919. Each student is listed as an author and contributed an event to the story.

myHistro would also be useful as a pre- or post-lesson resource for students or as a visual during a lesson or lecture. This American Revolution story tracks the history of discontent in the colonies and the lead-up to the American Revolution from 1689 to 1789. Each event has an explanation of its significance and several images. Another excellent example is this history of the United States, 1918-1939, which chronicles major events during this time.

For more information

Geography and history are intimately linked. Check out more tools for using maps to help make sense of history in Tech for Teachers, including WhatWasThere, Google Maps, Google Earth, and Social Explorer.

Not certain how to use maps in the classroom? Watch award-winning teacher Stacy Hoeflich introduce her students to John Smith's map of Virginia.

Making the Most of Maps

Image
Watercolor, Viewing the coasts by the Chart, 1838-1839, William H. Meyers, NYPL
Question

When a group of students has no prior experience or knowledge of using geography and maps in a social studies class, what are some ways that map/geography skills can be incorporated into a lesson?

Answer
Elementary Students

To some extent the answer to this question depends on the age of the children you are teaching. Given the abstract nature of maps, formal introduction to map skills is likely best done after age six. For these young learners, I suggest that you look at the newly redesigned National Geographic Education website that includes a mini-lesson on "What is a Map." This lesson introduces the concept of a map as a simplified model of reality. From there one of the best ways to introduce map reading is to create a map of a familiar area (such as the classroom) together. That and other elementary geography projects can be found on this teacher-created site.

For slightly older students map skills should include learning the vocabulary of maps: words and concepts such as legends, scales, and compass roses. Instruction can also begin to focus on the concept that mapmakers must be selective and can show only a limited number of things on each map. Try this lesson from the United States Geological Survey that gets to this point. In any case, it is important to teach students about maps and how to use them before asking them to read and analyze content-specific maps.

Once students have a basic understanding of maps, teachers can begin to explore the use of maps to highlight important historical concepts. Elementary school is not too early to begin this type of lesson. A video example of using maps to teach history in a 4th-grade classroom can be explored here. The main goal in this lesson is to engage students in actively asking questions of the primary source document (in this case John Smith's map of Tidewater Virginia) and interpreting and understanding what they are seeing.

Finding the Right Map for Your Classroom

The Library of Congress has a large collection of maps that can be used for historical study. The site also has a self-directed professional development module for teachers about how to access and use maps in social studies lessons. This module is useful if you are new to using maps to teach history. To learn even more about what to look for in historical maps I encourage you to read the short demonstration essay "Making Sense of Maps" by David Stephens of Youngstown State University.

Older Students
As with other print media, students must learn to ask why was this document made, for whom, and in what context.

High school students with weaker geography backgrounds may require a review of terms and fundamental spatial concepts. But it is even more important for this age group for you to teach dynamic geographic analysis skills. See this Teaching Guide that includes an easy-to-use 12-step handout to guide questioning about a map. It not only lists what to look for in a map, but also engages students in asking their own questions about what is represented (and what is not) and how that influences our understanding of the map. As with other print media, students must learn to ask why was this document made, for whom, and in what context.

Finally, I am excited by the new uses for older maps that are afforded by the new Geographical Information Systems (GIS) technologies. An example of a high school lesson plan using interactive mapping features can be found here. This is just one of several history lesson plans based on GIS technology that are becoming available.

Creativity is Key

In sum, a myriad of historical maps can now be found on the Internet and their use is just beginning to be fully explored by teachers. There are so many kinds of maps. Let your imagination run free. Become familiar with the types of materials that are out there and the ways in which they might be used and then try them out with your classes. A good starting point for looking for maps can be found online here, here, and here as well as at the Library of Congress. As a geography buff, I love the number and quality of teaching materials that are now available. Kids like to work with maps and geography is fun to teach. Good luck!

For more information

You may also enjoy reading our Tech for Teachers article on using Google Maps in the classroom.

Campaign Atlases

Image
Image for Campaign Atlases
Annotation

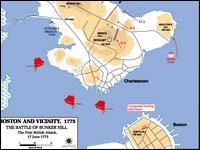
These 400 20th-century color maps of military campaigns cover a broad range of conflicts, from American colonial wars to U.S. involvement in Somalia in 1992—1993. Most of the maps represent conflicts in which the U.S. played a role, such as the "Battle of Bunker Hill" or the "Allied Landing in Normandy," although the collection also includes maps of the Napoleonic Wars, the Chinese Civil War, the Falkland Islands War, and Arab-Israeli conflicts.

Maps are indexed by war and may be enlarged, but are not annotated. The site is easy to navigate, although large maps may be slow to download. A bibliography lists eight atlases, published between 1959 and 1987, from which many of the maps were taken. The site is particularly useful for studying cartography and military history.

WhatWasThere

Image
screencap, WhatWasThere logo, 16 December 2011, Whatwasthere.com
What is it?

WhatWasThere.com is a free, dynamic site that allows historians of all ages to take a walk down memory lane as they pore over photos of the past. Created in Ann Arbor, MI, by Enlighten Ventures L.L.C., WhatWasThere lets users upload photos and place them at addresses found on Google Maps. Enlighten Ventures’ vision is to provide a photographic history of the world for users to investigate. Simply type in the name of a state, city, or local address and begin examining photos in the collection.

Getting Started

If you are ready to see the past, simply go to WhatWasThere.com and type in the name of the city, state, or country you are interested in exploring. Once at a specific location, the number of pictures available at a location is identified by map markers. Click on the marker and your time travel will commence. Zoom in or out of the map with the toggle bar located along the right-hand side of the screen. Look to the left to find thumbnails of the photographs available to study. Click on a photo, and you are taken to its exact location on the map. There, the photo detail tab allows you to learn the date the picture was taken and its title and read a detailed historical description. Roll over the photo with your mouse for a closer look. Another option is to click on the street view tab to see what your destination looks like today. The past will literally fade into the present as you adjust the sliding bar at the top of the photo. Again, you decide how much you want to see as additional photos found in the surrounding area are marked for further exploration. Using the photo markers provided, you can journey through the past of any area you have chosen.

The past will literally fade into the present as you adjust the sliding bar at the top of the photo.

While at WhatWasThere.com you can make history when you upload your own pictures or look at the latest photos that have been added to the website. If you have photos to share to help record your local history, become a member of the site to gain permission to post pictures. To set up a free account, just register a username, provide an email address, select a password, and begin uploading photos. "Tag" your photos with the year, location, descriptive information, your source, and the photo’s copyright status. If you know the street address of your image, you can position it on the Google street view, placing it directly over the address as it appears today. WhatWasThere is developing tools to let others who know your city help with the identification process if you are unsure of a photo's particular details. At this time, photos without specific addresses are not shared with other users.

Downloading the iPhone App for your iPhone or iTouch also allows you to access WhatWasThere.com mobilely, using the camera on your phone to view “an augmented reality experience of the history that surrounds you.” Consider friending WhatWasThere.com on Facebook to check out their version of “Today in History,” which daily features a photo from the site you can share with your students.

Examples

The most exciting aspects of WhatWasThere.com are its applications for use with students of all ages. Typically children view history through their modern lenses and not in the context in which events occurred. This site allows users to practice evidence-based thinking as they synthesize the evidence from historical photos with the information obtained from other sources. This will help students to begin thinking like a historian as they determine the impact of events that are recorded in history.

Sharpen your social scientist skills as you compare and contrast photos from the early 1900s with those of the present.

One example would be to use the site while learning about the Constitution. WhatWasThere will take your students on a virtual fieldtrip to Independence Hall. Once there, sharpen your social scientist skills as you compare and contrast photos from the early 1900s with those of the present. Class discussions can focus on the significance of this landmark, preservation issues, and any questions your students would like to investigate to help them learn more about the time period when the Constitution was written.

After students formulate questions, WhatWasThere.com is an excellent website for students to explore to help them understand “how we know what we know about the past.” WhatWasThere.com can encourage historical thinking as students “feel the history of a specific location in a new way.” Being exposed to America’s photographic history enables children to see the complexity of history from more than one point of view or perspective.

For more information

WhatWasThere not meeting your needs? Try Historypin, another online tool that organizes photos by time and place.

With the advent of the internet, you can find thousands of historic photographs with a few mouse clicks. Ask a Digital Historian has tips on where to start looking.

Visual primary sources are natural fits for students with developing English language skills. Get ideas for using photographs with English Language Learners in Teaching English Language Learners.

Your students will get the most out of visual sources if they source them—that is, if they ask where they came from. Learn a strategy for getting early elementary students excited about sourcing in Ask a Master Teacher.

Integrating History and Maps

Video Overview
Terri Ruyter and Michele Yokell discuss their experiences with the Becoming Historians TAH Grant project, in which they sought creative ways to help urban New York City students understand the natural landscape traversed by colonists and pioneers.
Video Clip Name
LL_Terri1.mov
LL_Terri3.mov
LL_Terri2.mov
LL_Terri4.mov
Video Clip Title
Mapping Western Expansion
Integrating History and Maps
Mapping Colonial New York
Learning Outside the Classroom
Video Clip Duration
3:45
3:37
1:54
1:46
Transcript Text

We work with a Teaching American History Grant called Becoming Historians. It's working with elementary school kids, and one of the units of study in the New York City curriculum for 5th grade is this idea of westward expansion, and we came up with this—we realized that we had a bit of a stumbling block because when you're talking westward expansion, it's a pretty traditional model and teachers are doing Oregon Trail. And our kids who live in New York City have no conceptual knowledge of what a plain is or a mountain or a mountain pass. They have very little understanding, even, of what happens upriver. So while we were getting ready to do this work around westward expansion and what's out there, we wanted to help the kids make pictures in their minds to really have good empathy and historical imagination of what's going on. We realized we needed to do some foundational work on mapping.

. . . when you're talking westward expansion, it's a pretty traditional model and teachers are doing Oregon Trail. And our kids who live in New York City have no conceptual knowledge of what a plain is or a mountain or a mountain pass.

So I contacted an elementary-school/middle-school teacher at Bank Street College of Education, Sam Brian, who's done a lot of work on geography teaching and young children. And he does this terrain model map and it's a generic model with mountains and valleys and you flood it and you can see how islands are formed from mountains that are connected to the land, but then they become submerged. So the kids can see all this stuff actually happening.

So they're getting that kind of general vocabulary, but then they're also getting specific vocabulary about mountains and peaks and passes and ranges and river valleys and estuaries and all that other kind of language that our children need.

So we had Sam work with us on the terrain models, and then the idea is you go from the terrain model to a map that the children draw, a two-dimensional map the children draw, of the terrain model.

They look at maps of the actual physical world and they trace river routes and they figure out where the Continental Divide is, because you have rivers draining into one ocean or the other, and so there must be something high up in between that's causing the water to flow downhill. So: "Aha! Those must be mountains." So then you draw in the mountains and then you label all the places. So there's a lot of really rich background work that takes place.

And from that point we went into maps of the Oregon Trail, historic maps from 1843 that we found on the Library of Congress website. And so the kids are doing critical map reading because now they have the knowledge to say, “Oh, it's a pass. It's a butte. It's a bluff.” They're reading those labels on the map and it means something to them because they've seen pictures of it and a three-dimensional model of it. Because it's hard for us in the city to take our kids to places that represent these things.

They're reading those labels on the map and it means something to them because they've seen pictures of it and a three-dimensional model of it.

So then we looked at the Oregon Trail maps and talked about those maps and used the NARA forms to analyze the map: Who is the author? What was the purpose? What was happening at the time? And then we took diaries of peoples' westward journeys and traced those journeys along the maps so the kids could start making the connection between, "Oh, on June first, July second, we passed Independence Rock." And on, "We went through Devil's Gate." And all those places are labeled on the maps, so the kids are then tracing the progression of the individual who wrote the diary along the map and trying to get in their head what it's all about.

Rethinking the Oregon Trail

Terri: We had a plan for the content, but it was kind of vague. And then coming out of conversations with teachers and making observations in classrooms and figuring out what resources we could pull together, we—like, my original idea for westward expansion was not to do the Oregon Trail, it was to crack it open and do stuff about black pioneers and Exodusters and stuff, but all the teachers are doing this Oregon Trail thing. So I decided to, like, put my desires aside, and then focus on the Oregon Trail thing to think about: How can we make this a more rich experience? How can we enhance what they're already doing in the classroom, so that they're not, like, tossing the baby out with the bathwater? To start with something totally new, or just going to my workshop and learning about the Exodusters and then filing it away and continuing on with their Oregon Trail stuff.

I mean, that's what—the resources in their classroom are largely Oregon Trail, which is why it's taught. So we use that to retool it and then we brought in this idea of mapping and that came from talking with teachers about what their kids needed and me trying to think about what resources I knew were in the city and how could we make this more engaging, more interesting.

Preventing Learning Fragmentation

We're really working on mapping the curriculum to see how it spirals up, so that you're introducing this idea of a grid maybe in 3rd or 4th grade, and then in 5th grade you're starting to introduce the ideas of latitude and longitude. When you're looking at the Oregon Trail maps, the grid becomes not "A, B, C, 1, 2, 3," it's "degrees north and south" that the kids are actually using to orient themselves on the map.

So it's a way of, you know—they understand the idea of grid, and then they go into the more complicated thing of latitude and longitude. And then we're trying to think about—break it apart. What's on the maps, the historic maps that they're actually using, and then how do we scaffold that so that it aligns with the history curriculum and the geography curriculum so that the kids are not doing the geography unit and then it's, like, done with that, knock that one off the list, let's go to history now.

. . . the kids are not doing the geography unit and then it's, like, done with that, knock that one off the list, let's go to history now.

'Cause Sam's been doing this work since the early mid-90s, I think, and he says that that's the one thing that he's consistently struggling with teachers to get them to do is to make that transition between the work that you do with the terrain models and the imaginary land maps, and then taking it back into social studies and having the teachers actually use it and have the kids apply the information and the ideas that they've gotten from the first part of the work. And so that's really what we're trying to make a little bit more obvious and to make it more articulate.

Michele: To give the teachers the knowledge, the actual content knowledge, to reinforce that because it's not just their field. You know, you have to really study up on it and know what you're teaching and know it in depth so that you actually understand yourself what you're teaching the kids and not be afraid to go a little bit further. We know how to do this very well in the language arts, because that's what New York City has been really focusing on, and understandably. But now it's time to put that focus into history, into geography, and to integrate it.

Terri: The Wildlife Conservation Society has a very cool project happening using historic maps to determine what New York City, Manhattan in particular, looked like in 1609 when Henry Hudson sailed up for the first time.

So Sam came and did the same work with the 4th-grade teachers. Instead of focusing on interior landforms, they focused on coastal landforms. So they thought about peninsulas and coves and bays and the river systems, so that that's all very immediately transferred to New York City and New York State geography, and it leads the kids very nicely into 5th grade. And then they did—they looked at historic maps of early colonial New Amsterdam and New York.

Bringing History Home

Michele: Kids are working in partnerships, we put transparencies over the flat version and then we actually go over where the rivers were, where the bluffs were, where the canyons are, where the coast is, so that they get a three-dimensional view on this flat map of what it was like before the skyscrapers, and also where our school is, where their houses are in relation to this. And then we look at it next to Manhattan now. Like: what’s happening now, what happened then.

Terri: Right. And since you did it on transparency, you can take this—

Michele: Right.

Terri: And lay it on top, and you can see how the shape of Manhattan has changed over time. 'Cause you can see that all the hills that were down on the Lower East Side are flattened and the marshes are filled in and the coastline has changed and the rivers are paved over, and you can see all that stuff on the map.

Michele: Along with the mapping, the idea of taking them on trips that reinforce what they're learning two-dimensionally.

Terri:: There's a living museum along the Hudson River called Philipsburg Manor, and it interprets colonial New York history from an enslaved person's perspective. So we thought of, like, taking the train up along the Hudson. You get to see the width of the Hudson. You see the Palisades on the New Jersey side. You can see that there are hills on the New York side, so that there's stuff you can see to, like, "Oh, right. That's a river. And there's a really long bridge going over that river. A couple of them."

Michelle: And also even when we got there, there are, like, sort of culverts where you see that the—go underneath the sidewalks. I mean, you can actually tell that there was water under there, you know? And when you look at these huge expanses of land, except for Central Park, we don't really have huge expanses of land. So—

Terri: Right. And all our rivers are—all of the rivers that are on these British headquarter maps are all gone.

I think that when you do tie together these 3D models and you actually have them make their own maps and you have them take the trips and then tie in the history that goes with it, it gives a much better experience than just trying to read a standard text. . .

Michele: I think that when you do tie together these 3D models and you actually have them make their own maps and you have them take the trips and then tie in the history that goes with it, it gives a much better experience than just trying to read a standard text, which really is what people failed with. And because of this previous failure, I think teachers shied away. And now we're really giving alternatives to text, which are much better.
David Rumsey Map Collection

Image
Image for David Rumsey Historical Map Collection
Annotation

This private collection presents more than 15,800 rare historical maps with a focus on North and South America. The collection is accessible via several formats. A standard browser (the "directory") is designed for use by the general public. In addition to two browsers and a "collections ticker" requiring Insight software (available for free download), a GIS browser shows detailed overlays of maps and geospatial data for the more serious researcher.

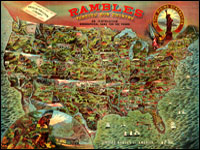
Many of the U.S. maps are from the late 19th and early 20th centuries and are often notable for their craftsmanship. Materials include atlases, globes, books, maritime charts, pocket and wall maps, and children's maps. Users can zoom in to view details. Overlay capabilities make this site valuable for its ability to convey how locations have changed over time.

Osher Map Library

Image
Image for Osher Map Library
Annotation

These 14 exhibitions include more than 600 maps and related documents on aspects of history revealed through the study of maps. The website provides well-integrated essays of up to 8,000 words for each exhibit and some annotated bibliographies.

Exhibits focusing on American history include "Mapping the Republic," on conflicting conceptualizations of the U.S. from 1790 to 1900; "Exodus and Exiles," on Diaspora experiences of Jews and African Americans; "The American Way," a collection of 20th-century road maps and guidebooks; "Carto-Maine-ia," on popular uses of maps; and "Maine Wilderness Transformed," that examines "the creation of a landscape of exploitation."

In addition, "The Cartographic Creation of New England," addresses European exploration and settlement, "The 'Percy Map,'" presents a significant Revolutionary War map; and "John Mitchell's Map" offers insight into diplomatic disputes. These maps are especially valuable for studying exploration and cartography in American history.

Historical Maps of the United States

Image
Map, Exploration Before 1675
Annotation

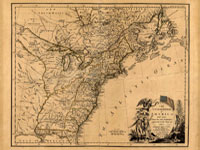
This division of the Perry-Castaneda Map Collection provides access to 500 historical maps of the U.S. Maps are sorted thematically and include three maps of early inhabitants, 11 of exploration and early settlement from 1675 to 1854, and 15 of territorial growth from 1775 to 1970. Of the 95 military history maps covering engagements from 1763 to 1967, 50 are about World War II alone.

Among 183 late 19th- and 20th-century maps, there are 146 of U.S. cities produced around 1920. Historic sites, memorials, and battlefields are represented in 191 maps of sites such as Aztec ruins in New Mexico, the Bering land bridge in Alaska, and the Vicksburg battle site in Mississippi. Most of the maps are excerpted from 20th-century historical atlases. The site will be particularly useful for research in military history and early 20th-century urban history.