myHistro

Image
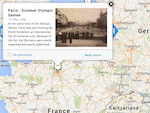
Screencapture, Olympic Games, Jala Peno, myHistro, 2013
What is it?

myHistro is a storytelling tool that allows you to place events both geographically and on a timeline to tell a story. Users create stories that can have multiple events each of which takes place in a different time and place. The tool allows you to incorporate video, images, and text to narrate the story for users as they click through.

Getting Started

To start using myHistro, click the "Sign Up" button on the homepage. Provide your name and email address and you are ready to start creating a story.

To begin creating, select "Create a New Story." Type a name, a short description, and select a thumbnail image for your story. There is also the option to list several authors for the story—useful for students who are working as a group. Clicking on the "Tags, privacy, comments" hyperlink takes you to options that allow you to tag the story with relevant keywords, control who can see the story, and control who can comment once the story is finished.

Once you've created a story you'll want to create a few (or more) events to fill the story. Clicking the green "Next" button or the grey "Add and Manage Events" bar takes you to the event creation page. Here you can create as many events as you'd like to include in your story. Clicking "Create New Event" allows you to add a new event. You can set the start and end date (optional) for the event as well as add a time. If the event doesn't have a specific day or month associated with it, you can set them as unknown and just use the year. You can also set the date manually so that it can include a prehistoric date (BC) by selecting "Set Manually" at the bottom of the drop-down list under year.

You'll also want to set a location associated with an event. The map allows you to select from several map types including Satellite, Hybrid, Terrain, and the normal Google Maps view. You can plot the location of the event using the traditional map marker or you can use the drawing tools to draw a shape or a line on the map.

Once you've added your events, finalize your story by selecting "Save story." You'll then be taken to view your story. From here you can export, embed, or comment on your story. For a more detailed orientation to the options available within myHistro, see their Slideshare entitled "History Visualization: Basic Guidelines for History Teachers.”

Examples

myHistro could be used as either a teaching and presentational tool or as a project for students. The combination of creating a timeline and narrative and placing those within a geographical location require students to practice arranging and interpreting events in both time and space. The tool is probably best used with students of middle school age or older because of the complexity of creating stories and events.

Creating a story could help students review a unit or review for an exam, either in a group or individually. In this AP United States history project, each student from the class contributed in order to create a story of important events in U.S. history from 1619 to 1919. Each student is listed as an author and contributed an event to the story.

myHistro would also be useful as a pre- or post-lesson resource for students or as a visual during a lesson or lecture. This American Revolution story tracks the history of discontent in the colonies and the lead-up to the American Revolution from 1689 to 1789. Each event has an explanation of its significance and several images. Another excellent example is this history of the United States, 1918-1939, which chronicles major events during this time.

For more information

Geography and history are intimately linked. Check out more tools for using maps to help make sense of history in Tech for Teachers, including WhatWasThere, Google Maps, Google Earth, and Social Explorer.

Not certain how to use maps in the classroom? Watch award-winning teacher Stacy Hoeflich introduce her students to John Smith's map of Virginia.
Making the Most of Maps

Image
Watercolor, Viewing the coasts by the Chart, 1838-1839, William H. Meyers, NYPL
Question

When a group of students has no prior experience or knowledge of using geography and maps in a social studies class, what are some ways that map/geography skills can be incorporated into a lesson?

Answer
Elementary Students

To some extent the answer to this question depends on the age of the children you are teaching. Given the abstract nature of maps, formal introduction to map skills is likely best done after age six. For these young learners, I suggest that you look at the newly redesigned National Geographic Education website that includes a mini-lesson on "What is a Map." This lesson introduces the concept of a map as a simplified model of reality. From there one of the best ways to introduce map reading is to create a map of a familiar area (such as the classroom) together. That and other elementary geography projects can be found on this teacher-created site.

For slightly older students map skills should include learning the vocabulary of maps: words and concepts such as legends, scales, and compass roses. Instruction can also begin to focus on the concept that mapmakers must be selective and can show only a limited number of things on each map. Try this lesson from the United States Geological Survey that gets to this point. In any case, it is important to teach students about maps and how to use them before asking them to read and analyze content-specific maps.

Once students have a basic understanding of maps, teachers can begin to explore the use of maps to highlight important historical concepts. Elementary school is not too early to begin this type of lesson. A video example of using maps to teach history in a 4th-grade classroom can be explored here. The main goal in this lesson is to engage students in actively asking questions of the primary source document (in this case John Smith's map of Tidewater Virginia) and interpreting and understanding what they are seeing.

Finding the Right Map for Your Classroom

The Library of Congress has a large collection of maps that can be used for historical study. The site also has a self-directed professional development module for teachers about how to access and use maps in social studies lessons. This module is useful if you are new to using maps to teach history. To learn even more about what to look for in historical maps I encourage you to read the short demonstration essay "Making Sense of Maps" by David Stephens of Youngstown State University.

Older Students
As with other print media, students must learn to ask why was this document made, for whom, and in what context.

High school students with weaker geography backgrounds may require a review of terms and fundamental spatial concepts. But it is even more important for this age group for you to teach dynamic geographic analysis skills. See this Teaching Guide that includes an easy-to-use 12-step handout to guide questioning about a map. It not only lists what to look for in a map, but also engages students in asking their own questions about what is represented (and what is not) and how that influences our understanding of the map. As with other print media, students must learn to ask why was this document made, for whom, and in what context.

Finally, I am excited by the new uses for older maps that are afforded by the new Geographical Information Systems (GIS) technologies. An example of a high school lesson plan using interactive mapping features can be found here. This is just one of several history lesson plans based on GIS technology that are becoming available.

Creativity is Key

In sum, a myriad of historical maps can now be found on the Internet and their use is just beginning to be fully explored by teachers. There are so many kinds of maps. Let your imagination run free. Become familiar with the types of materials that are out there and the ways in which they might be used and then try them out with your classes. A good starting point for looking for maps can be found online here, here, and here as well as at the Library of Congress. As a geography buff, I love the number and quality of teaching materials that are now available. Kids like to work with maps and geography is fun to teach. Good luck!

For more information

You may also enjoy reading our Tech for Teachers article on using Google Maps in the classroom.

Campaign Atlases

Image
Image for Campaign Atlases
Annotation

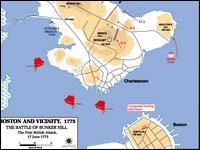
These 400 20th-century color maps of military campaigns cover a broad range of conflicts, from American colonial wars to U.S. involvement in Somalia in 1992—1993. Most of the maps represent conflicts in which the U.S. played a role, such as the "Battle of Bunker Hill" or the "Allied Landing in Normandy," although the collection also includes maps of the Napoleonic Wars, the Chinese Civil War, the Falkland Islands War, and Arab-Israeli conflicts.

Maps are indexed by war and may be enlarged, but are not annotated. The site is easy to navigate, although large maps may be slow to download. A bibliography lists eight atlases, published between 1959 and 1987, from which many of the maps were taken. The site is particularly useful for studying cartography and military history.

Historic USGS Maps of New England

Image
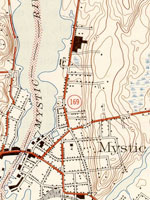
Map, "Mystic, CT-NY-RI Quadrangle," 1944
Annotation

A collection of more than 1,100 topographical maps created by the United States Geological Survey from the 1890s to the 1950s covering all of New England—Maine, New Hampshire, Vermont, Rhode Island, Massachusetts, and Connecticut—and selected areas of New York. The maps—which reveal roads, buildings, rail lines, bodies of water, and elevations—occur in 15-minute and 7.5-minute quadrangle series (a minute is one-sixtieth of a degree of latitude or longitude). In addition, the collection includes six maps with 30-minute quadrangles.

For states other than New York, users can view a state image map and select a point within a grid marked off in 15-minute increments to find listings for available images accompanied by dates the maps were surveyed, created, and revised. Towns within each quadrangle are also listed along with names of adjacent areas. Users also may search an alphabetical list of towns within each state. For New York, only an index of quadrangles names is available. Maps are presented in JPEG format. According to the site, "Each image is typically 2 megabytes, so download times are likely to be slow." A useful site for those studying changes in the New England landscape during the first half of the 20th century.

David Rumsey Map Collection

Image
Image for David Rumsey Historical Map Collection
Annotation

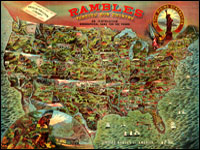
This private collection presents more than 15,800 rare historical maps with a focus on North and South America. The collection is accessible via several formats. A standard browser (the "directory") is designed for use by the general public. In addition to two browsers and a "collections ticker" requiring Insight software (available for free download), a GIS browser shows detailed overlays of maps and geospatial data for the more serious researcher.

Many of the U.S. maps are from the late 19th and early 20th centuries and are often notable for their craftsmanship. Materials include atlases, globes, books, maritime charts, pocket and wall maps, and children's maps. Users can zoom in to view details. Overlay capabilities make this site valuable for its ability to convey how locations have changed over time.

Osher Map Library

Image
Image for Osher Map Library
Annotation

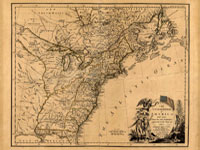
These 14 exhibitions include more than 600 maps and related documents on aspects of history revealed through the study of maps. The website provides well-integrated essays of up to 8,000 words for each exhibit and some annotated bibliographies.

Exhibits focusing on American history include "Mapping the Republic," on conflicting conceptualizations of the U.S. from 1790 to 1900; "Exodus and Exiles," on Diaspora experiences of Jews and African Americans; "The American Way," a collection of 20th-century road maps and guidebooks; "Carto-Maine-ia," on popular uses of maps; and "Maine Wilderness Transformed," that examines "the creation of a landscape of exploitation."

In addition, "The Cartographic Creation of New England," addresses European exploration and settlement, "The 'Percy Map,'" presents a significant Revolutionary War map; and "John Mitchell's Map" offers insight into diplomatic disputes. These maps are especially valuable for studying exploration and cartography in American history.