Envisaging the West: Thomas Jefferson and the Roots of Lewis and Clark

Image
Image for Envisaging the West: Thomas Jefferson and the Roots of Lewis and Clark
Annotation

By the time Thomas Jefferson became the third President of the United States in 1801, interest in exploring the West had begun to shape U.S. policy. This chronological narrative traces Jefferson's life, participation in politics, and accumulation of scientific geographical knowledge from 1735 to 1804. There are four main sections: "The Jeffersons and Their Frontier Virginia Neighborhood," "From Colony to Commonwealth," "Science and Statecraft at Home and Abroad," and "Public Servant to the Early Republic."

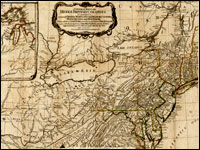
This narrative is accompanied by an archive of 169 letters, statues, books, treaties, maps, and journals providing primary source insight into Jefferson's thoughts about the West and the Lewis and Clark expedition in particular. Three interactive maps from the 1700s, overlaid with historical data about cities, private dwellings, natural features, courthouses, and waterways, provide important insight into the geographic and social environment at the time.

Map Collections: 1500-2003

Image
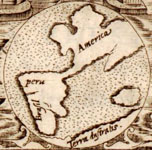
Image, Historia general..., Antonio de Herrera y Tordesillas, c. 1601-1615, LoC.
Annotation

This large collection of maps from the 16th century to the present day focuses on Americana and cartographic treasures.

Materials are organized into seven thematic categories—Cities and Towns, Conservation and Environment, Discovery and Exploration, Cultural Landscapes, Military Battles and Campaigns, Transportation and Communication, and General Maps. Sections include five special presentations.

Users may download maps or zoom in to view details. Seventeen specific map collections contained within this larger site that are of particular importance for the study of American history include "Discovery and Exploration," "The American Revolution and Its Era," "Railroad Maps, 1828–1900," "American Colonization Society Collection: Maps of Liberia, 1830–1870," "Panoramic Maps, 1847–1929," "Civil War Maps," and "Mapping the National Parks."

Researching the Role of the Map in History Teaching

Image
oster, Map Your Course. . . , 1941-1945, Office of Emergency Mgm't., NARA
Question

I am doing some research on the use of maps to teach history. Any suggestions for research or theory would be helpful.

Answer

To get oriented to how maps can be used to teach history and begin exploring links to relevant websites, this newsletter can be a useful first stop. You will find links to videos of teachers using historical maps, checklists for what to focus on when teaching with maps, reviews of best practices, and links to teaching modules. The fundamental idea behind these resources is that geography can provide the context for sophisticated historical thinking if students are encouraged to actively think about what maps show and why they show it.

One of the clearest rationales for using maps to teach history that I have seen can be found in a recent book by David Rumsey(1) and Meredith Williams entitled Historical Maps in GIS. The authors argue that:

Historical maps often hold information retained by no other written source, such as place-names, boundaries, and physical features that have been modified or erased by modern development. Historical maps capture the attitudes of those who made them and represent worldviews of their time.

Geographic Information System (GIS) is an exciting new tool for history and geography educators that has been the focus of some recent research. If this is of interest you might begin your exploration of the benefits of using GIS by reading "Using GIS to Answer the 'Whys' of 'Where' in Social Studies" by Marsha Alibranadi and Herschel M. Sarnoff. In the article, the authors discuss not only the pedagogical and social benefits of using GIS, but also use real classroom examples to reflect on the challenges that the technology poses.

[. . . S]tudies might show how to develop map reading skills, but they rarely show how to interrogate the map as a document. . .

The most recent research on using maps to teach traditional geography that I could find was Ava L. McCall's "Promoting Critical Thinking and Inquiry through Maps in Elementary Classrooms" published in The Social Studies. The critical thinking that is promoted by this work is very similar to contextualized historical thinking. This is a key point. One of the difficulties in finding research on using maps in history education is that researchers often aren't looking for the dynamic recursive relationships between history and geography that are critical to both disciplines. For instance, studies might show how to develop map-reading skills, but they rarely show how to interrogate the map as a document as a means of determining why it was created and for whom, or how it helps us understand the past. There is very little research using this orientation to historical and geographical relationships.

Depending on your specific research interests, you may want to consult the following resources. You may not have access to all of the materials but if you see something of interest you can contact your librarian. Or you may try a trial membership. The large national database on educational research can be accessed here. Two journals (Theory and Research in Social Education and The History Teacher) devoted to history and social educational research can be accessed here and here. And finally, if you are interested in international research in geography education you may want to look at the Review of International Geographic Education Online or back issues of the journal Research in Geographic Education.

Good luck with your research and let us know if you discover anything.

(1)Rumsey is a map aficionado who has compiled an enormous database of historical map images that he has posted for free on the Internet. It's worth exploring.

Contradictions in John Fremont's Political Chart of the US (1856)

field_image
detail of Fremont's chart
Question

The question concerns John Frémont's Political Chart of the United States (1856). Typically, we think of the north as being more industrialized at this point and the south as more agricultural. Yet, under the heading of area on the right of this document the following information is included: No. of farms in slave states – 569,201; No. of farms in free states – 873,678.

That fact from a primary source contradicts what we typically think about the economy of the north and south in the antebellum era. Explain this contradiction. Where were all these farms in the north? Why were there more farms in the north? Was Mr. Frémont referring to small farms?

Answer

The period during which Frémont's chart appeared was one of rapid industrialization and urbanization in the Northeastern states. Economic historian Douglass C. North has identified the 1840s and early 1850s as the era in which "the pace of industrialization accelerated to the degree that the Northeast could unequivocally be called a manufacturing region."

In 1850, urban population in the Northeast accounted for 27 percent of the total population, while the South was only eight percent urban. During the next decade, the South remained predominately rural, with 10 percent of its population living in cities or towns in 1860, while the Northeast continued to urbanize at a swift pace, with an urban population that had grown to 36 percent. Despite the region's growth in industry and urban population, the Northeast retained a large rural population: 73 percent of its total population in 1850 and 64 percent in 1860. Yet, the size of the rural Northeastern population accounts only for part of the answer to the apparent contradiction stated in the question. The seeming paradox can be only resolved if we start by noting the exact language that was used in Frémont's chart.

Fremont's Language

The chart explicitly referred to "free states," not states in the North or Northeast. During this period, the number of farms in the developing area that we now call the Midwest—which with the exception of Missouri was composed solely of free state—increased at a faster pace than in any other region of the nation due to the increasing ability of persons of modest means to purchase newly available, relatively small plots of public land. These new farms tended more and more to be oriented to the market rather than to self-sufficiency. The concurrent rise in urban population in the Northeast was closely related to the growth of agriculture as a commercial enterprise in the Midwest. As cities grew, so did a demand for food that Midwestern farmers supplied. A closer look at the statistics and at the analyses of agricultural and economic historians will help make further sense of the situation.

The number of farms listed on Frémont's chart was derived from the 1850 census (with one small discrepancy—while the chart lists 873,678 farms in free states, the total calculated from the census actually comes to 873,608). According to census figures, New England states (Maine, Vermont, New Hampshire, Massachusetts, Rhode Island, and Connecticut) accounted for 19 percent of the farms in free states, or 167,651 farms; Middle Atlantic free states (New York, Pennsylvania, and New Jersey) totaled 37 percent or 322,103 farms; and the Midwestern free states (Ohio, Indiana, Illinois, Michigan, Wisconsin, and Iowa) 44 percent or 382,982. (The census listed only 872 farms in California, the only state in the far west that had been admitted to the Union by that time.) New York led the free states in number of farms with 170,621. Ohio, the first Midwestern state to be settled, came in second with 143,807. Pennsylvania followed with 127,577, Indiana had 93,896, and Illinois 76,208. In the slave states, Virginia had the most farms with 77,013, followed by Kentucky with 74,777, Tennessee with 72,735, North Carolina with 56,963, Missouri with 54,458, and Georgia with 51,759.

The Business of Agriculture

During the decade of the 1850s, the total number of farms in the U.S. increased by 41 percent, from 1,442,908 to 2,030,785 farms. Nearly half of the new farms were located in the free states of the Midwest. In his classic work of U.S. agricultural history, The Farmer's Age: Agriculture, 1815–1860, Paul W. Gates stated that the "rush for the public domain" during the 1850s "surpassed anything in previous history." Gates attributed the rise in land sales to lower prices and to "[f]rantic railroad building, particularly in the upper Mississippi Valley; the great influx of Germans, Scandinavians, and Easterners into the West; and a new era of banking experiments which greatly increased available credit." Historians have identified this period as part of an "agricultural revolution" that eventually led to the passage of the Homestead Act of 1862, through which homesteading settlers could obtain 160 acres of public land free of charge.

The revolution, which encouraged land speculators in addition to settlers, marked a major shift in agricultural practice in the free states, as "by the 1850s, market-oriented agriculture was firmly established as the dominant approach, clearly distinguishable from the semisubsistence approach," according to agricultural historian Clarence H. Danhof. Economic historian Harold D. Woodman has characterized the "large class of property owners on western lands" during this period as consisting "neither of peasant proprietors nor of yeoman farmers but, rather, of businessmen on the make."

Land Sales

Two visions of the nation's future had dominated early legislative initiatives regarding land sales from the federal government, which under the Articles of Confederation had acquired all state-owned lands west of the Appalachians. Alexander Hamilton and his Federalist followers believed that prices for public land should be set at high levels both to benefit the U.S. treasury and to discourage agriculture in favor of manufacturing endeavors. In contrast, Thomas Jefferson and like-minded politicians, who envisioned a republic of yeoman family farmers, sought low prices for small lots of land that could be purchased on credit by people of average means.

Federalist policy prevailed in early land sales legislation; in 1790, the minimum cost for land purchased from the government was set at $1,280 and the minimum amount sold was set at 640 acres. Due to poor sales, later legislation gradually relaxed maximum and minimum terms, so that by 1820, the minimum price of an acre had dropped from a high of $2 to $1.25 and the minimum amount that could be sold was lowered to 80 acres. In 1832, this amount was reduced further to 40 acres, and by 1854, the minimum price for public land that had remained unsold for more than 30 years was lowered drastically to 12 ½ cents per acre.

The federal government sold nearly 50 million acres between 1850 and 1859. In free states, the number of farms increased by 44 percent to 1,255,518 farms, while those in the slave states increased by 36 percent to 775,267. Midwestern states experienced the highest growth rate in numbers of farms among all regions of the nation. Between 1850 and 1860, the number of farms in the New England states increased by 10 percent, with 16,291 new farms bringing the total to 183,942. Middle Atlantic states increased its number of farms by 18 percent with an additional 58,890 to total 380,993 farms.

Midwestern states (including Minnesota, which had become a state in 1858) increased their number of farms by 74 percent with an additional 283,079 farms to total 666,061, or 53 percent of free state farms. New York, Ohio, and Pennsylvania remained the states with the largest number of farms in the free states (196,990, 179,889, and 156,357, respectively), while Illinois had jumped to fourth place with 143,310 and Indiana increased to 131,826.

The far western states of California and Oregon (admitted to the Union in 1859) with 24,522 farms, accounted for 2 percent of the total number of farms in the free states. The number of farms in southern states in which public lands were sold increased dramatically: by 26 percent in Mississippi, 29 percent in Louisiana, 31 percent in Alabama, 53 percent in Florida, 70 percent in Missouri, 120 percent in Arkansas, and 252 percent in Texas. While the number of farms in the South grew at a greater rate than that of the Northeast, they increased by less than half the rate of Midwestern farms.

Size and Numbers

While the number of farms in the South was less than that of the Northeast and the Midwest combined, the size of farms in slave states was greater on average than those in free states. In 1850, the average-sized farm in the slave states was 318 acres; in the free states, the average size was 128 acres, or 40 percent of the size of an averaged-sized farm in the South. The average size of farms in both free and slave states remained near constant from 1850 to 1860. According to the 1860 census, an average-sized farm in the free states in 1860 was 125 acres, or 3 acres smaller than in 1850, while in the slave states the average acreage had increased from 318 to 319.

Frémont's Midwestern supporters, who put together the chart, were part of a growing movement of farmers who "broke politically with southern planters in the 1850s," according to agriculture and economics professor Willard W. Cochrane. These farmers, Cochrane has written, "came to resist the extension of slavery and the plantation system out of fear of competition from large plantation units based on slave labor with their small family-sized units." In order to survive during the transition to market-oriented farming, they allied themselves more with economic interests in the Northeast than with planters in the South. "The stage was thus set for the realignment of political power, the founding of the Republican party, and the eventual War between the States," Cochrane concluded.
For more information

A detailed copy of the chart, from the Chicago Historical Society, is online at the Lincoln at 200 website.

Bibliography

Agriculture of the United States in 1860: Compiled from the Original Returns of the Eighth Census., under the direction of the Secretary of Interior, by Joseph C. G. Kennedy, Superintendent of Census. Washington: Government Printing Office, 1864.

Jeremy Atack and Fred Bateman, To Their Own Soil: Agriculture in the Antebellum North. Ames: Iowa State University Press, 1987.

Jeremy Atack, Fred Bateman, and William N. Parker, "Northern Agriculture and the Westward Movement," in The Cambridge Economic History of the United States. Vol. II: The Long Nineteenth Century. Edited by Stanley L. Engerman and Robert E. Gallman. Cambridge, UK: Cambridge University Press, 2000.

Willard W. Cochrane, The Development of American Agriculture: A Historical Analysis. 2d Edition. Minneapolis: University of Minnesota Press, 1993.

Clarence H. Danhof, Change in Agriculture: The Northern United States, 1820–1870. Cambridge, Mass.: Harvard University Press, 1969.

Robert E. Gallman, "Commodity Output, 1839–1899," in Trends in the American Economy in the Nineteenth Century. Edited by William N. Parker Princeton, Princeton University Press, 1960.

Paul W. Gates, The Farmer's Age: Agriculture, 1851–1860. New York: Holt, Rinehart and Winston, 1960; reprint, Armonk, NY: M. E. Sharpe, 1989.

Historical Statistics of the United States: Colonial Times to 1970, Bicentennial ed. Washington: U.S. Dept. of Commerce, Bureau of the Census, 1975.

Douglass C. North, The Economic Growth of the United States, 1790–1860. New York: W. W. Norton, 1966.

Harold D. Woodman, "Economy from 1815 to 1865," in Encyclopedia of American Economic History: Studies of the Principal Movements and Ideas. Edited by Glenn Porter. New York: Charles Scribner's Sons, 1980.

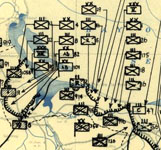
Northwestern European Military Situation Maps from World War II

Image
Image, HQ Twelfth Army Group situation map, June 8, 1944, Library of Congress.
Annotation

Created by the First United States Army Group and the Twelfth Army Group, this collection consists of 416 situation maps from World War II. The maps show the daily positions of Allied army units during the campaigns in Western Europe, from the D-Day invasion on June 6, 1944, through Allied occupation in July 26, 1945. There are also more than 100 reports from the campaigns.

Maps offer insight into daily activities, but also a broad view of movement over time. In addition, they highlight the incomplete nature of information available to commanders in the field during war time. Visitors can search the collection or browse the maps and reports by title, creator, subject, place, or date. The site also includes an interactive essay on the Battle of the Bulge. Visitors can select the desired zoom level and window size for viewing maps.

Cultural Readings: Colonization and Print in the Americas

Image
Image for Cultural Readings: Colonization and Print in the Americas
Annotation

Texts about the Americas produced in Europe from the 15th through the 19th centuries are examined in this well-organized online exhibit. Over 100 images of printed texts, drawings, artwork, and maps from published and unpublished sources are arranged into six thematic categories. Categories are named: "Promotion and Possession," "Viewers and the Viewed," "Print and Native Cultures," "Religion and Print," "New World Lands in Print," and "Colonial Fictions, Colonial Histories."

Five scholarly essays (5,000 to 7,000 words each) contextualize the documents. A bibliography and list of links accompany the presentation. A visually attractive, thoughtfully arranged site that explores connections between colonization and representation.

Archive of Early American Images

Image
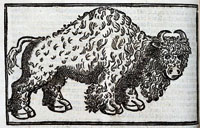
Buffalo, Archive of Early American Images
Annotation

The images in this collection, focusing on the Americas, come from books printed or created in Europe between about 1492 and 1825. Images include woodcuts, copper engravings, and paintings. The database, still being compiled, currently contains 6,685 images and will eventually contain some 7,500 images. Image viewing software is available from the site.

The visitor can browse the entire archive or search by time period, geographical area, keyword, or subject, including indigenous peoples, flora and fauna, artifacts, industry, human activities, geography, maps, city views and plans, and portraits. Some images, such as Ptolemy's map of the world, may be familiar. Others are reproduced for the first time. Navigation requires some practice, but is worth the effort.

Rare Revolutionary War-Era Map

Description

From the Library of Congress website:

"David M. Rubenstein, co-founder and managing director of The Carlyle Group, has given the Library of Congress stewardship of the first map printed in North America, depicting the boundaries of the new American nation and showing the 'Stars and Stripes' for the first time. Abel Buell's map 'A New and Correct Map of the United States of North America Layd Down from the Latest Observations and Best Authorities Agreeable to the Peace of 1783' is the first to be copyrighted in the United States and was published only six months after the Treaty of Paris signing (Sept. 3, 1783) ended the Revolutionary War."

Understanding the Battle of Gettysburg Using GIS

Description

Dr. Anne Knowles of Middlebury College answers the question "What could Lee see at Gettysburg?" Dr. Knowles builds two digital terrain models of the battlefield, one from 1996 data derived from aerial photographs, the other based on contour lines extracted from an 1874 map of the battlefield. Using a technique called viewshed analysis, she investigates how lines of sight and real-time geographic information may have influenced commanders' decisions and terrain perceptions. The results suggest that historical maps and evidence from the physical landscape can shed new light on even the most familiar historical subjects.

Introduction: Maps

Description

Cultural resources manager of the Anacostia Museum Portia James displays and discusses a tourist's map from post-World War I or -World War II which specified hotels, restaurants, and other businesses where African Americans could receive service free of discrimination and segregation.

To view this clip, select "Scholars," followed by "Portia James." Next, select one of the two Windows Media options.