Archive of Early American Images Anonymous (not verified) Fri, 01/25/2008 - 22:21
Image
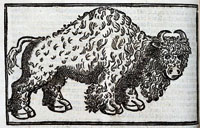
Buffalo, Archive of Early American Images
Annotation

The images in this collection, focusing on the Americas, come from books printed or created in Europe between about 1492 and 1825. Images include woodcuts, copper engravings, and paintings. The database, still being compiled, currently contains 6,685 images and will eventually contain some 7,500 images. Image viewing software is available from the site.

The visitor can browse the entire archive or search by time period, geographical area, keyword, or subject, including indigenous peoples, flora and fauna, artifacts, industry, human activities, geography, maps, city views and plans, and portraits. Some images, such as Ptolemy's map of the world, may be familiar. Others are reproduced for the first time. Navigation requires some practice, but is worth the effort.

Making Sense of Advertisements

Article Body

Advertisements are all around us today and have been for a long time; advertising-free "good old days" just don't exist. This guide offers an overview of advertisements as historical sources and how historians use them; a brief history of advertising; questions to ask when interpreting ads as historical evidence; an annotated bibliography; and a guide to finding advertisements online.

Liberty and Freedom: A Visual History of America's Founding Ideas, Part One

Description

Professor David Hackett Fischer traces how definitions of the ideals of liberty and freedom have changed over the course of U.S. history, from the American Revolution to the present day. He looks particularly at visual and literary symbols that have been created to stand for these ideals.

Part Two of this lecture is currently not functioning.

Joe Jelen on the New York Public Library Digital Gallery

Date Published
Image
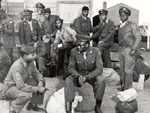
Photographic prints, Among first to enter action, 1940s, United States Army--Sig
Article Body
Overview

The New York Public Library offers a digital gallery of many photographs and artifacts from its collections. The NYPL–Digital Gallery features a searchable index of thousands of pictures and artifacts related to a wide variety of subjects in American history. Best of all it is free and easy to use.

How to Find What You’re Looking For

Next time you are looking for a photograph of an important historical figure, try using the NYPL-Digital Gallery to search for images of him/her. A simple search in the NYPL search engine box on the home page can unearth thought-provoking photographs, like this candid shot of President Grover Cleveland. This image says a lot more than the images one would obtain from a basic Internet image search.

Also from the home page, try browsing by subject and look for documents related to your state. There are many great images that capture towns and cities in the past. This is a fantastic way to tie in local history. On a digital map, instruct students to locate where an old building once stood using a site like WhatWasThere.com. Students could also compare this detailed 1911 collection of photos of 5th Avenue to a Google Maps street view of 5th Avenue today to show students the impact of urbanization.

The NYPL-Digital Gallery can also help locate sources that might display social change over time. For instance, you might find pictures showing how bridal fashion has changed over time. If you click ‘Browse Sources’ and type “brides” into the ‘Explore Subjects’ search box, you will see a link to pictures tagged by this subject from 1400 through 1939.

Instructional Ideas

One of the skills we want to teach history students is how to ask the right questions. A way to practice this might be with the use of interesting images, like this one, of a “courting stick” in action. This photo begs students to ask many questions. A courting stick is a long, hollow tube around six feet long with a mouthpiece at each end. It allows courting couples to discreetly speak with one another while maintaining the appropriate physical boundaries. If you simply browse the depths of the NYPL-Digital Gallery for 10 minutes, you are bound to stumble across a treasure like this that will capture your students’ historical curiosity.

Another idea is to have students create a digital timeline incorporating images found in the Digital Gallery to demonstrate the concept of change over time. This assignment asks students to analyze changing American culture. Students could use the subject search feature of the Digital Gallery to find images related to sports, weddings, leisure, and other cultural phenomena in America over the last 250 years.

Allow yourself an opportunity to explore this vast collection of primary sources for use in your classroom. Give your students time to investigate the Digital Gallery as well. After all, this is one way historians craft questions about the past. In my browsing, I stumbled across this revealing group of photos related to African Americans serving in World War II. The photos capture the many ways African American men and women served during the war.

The NYPL-Digital Gallery is a one-stop-shop for primary sources on every topic in American history, and it is organized in a logical way, making it easy to collect documents and images.

The NYPL-Digital Gallery is a one-stop-shop for primary sources on every topic in American history, and it is organized in a logical way, making it easy to collect documents and images. As you search for images you may want to create a collection of images for a class. You will note, above each image is a button to “select” the image. By selecting a picture it is stored in “My Collection,” accessible from the home page and from the menu bar at the top of each page. This function is handy when building a lesson around a group of documents. As you find new ways to use the NYPL-Digital Gallery I hope you will share them with us here.
For more information

The NYPL Digital Gallery is only one of hundreds of primary-source archives online. Search our Website Reviews for more storehouses of visual, textual, and multimedia materials! Once you've found sources, Using Primary Sources gives you tips on modeling analysis for students.

People Power: How Art Depicts the Roles of People in Power

Description

Heroes, kings, popes, and saints are but a few of the roles mankind uses to depict figures possessing power. How have artists portrayed this power? Museum Educator Joseph Covington provides some answers as he leads you through the Museum's European and American collections.

Registration Deadline
Sponsoring Organization
North Carolina Museum of Art
Phone number
919-664-6781
Target Audience
3-8
Start Date
Cost
$18 ($16 for Educator members)
Course Credit
Partial credit .25 CEU
Duration
Two and a half hours

ThingLink

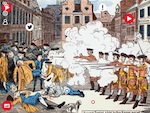
Image
What is it?

Starting out with ThingLink is straightforward—you have two choices for accessing ThingLink: create an account at ThingLink.com or download the ThingLink app. In either case, new users have to register for an account. There are no additional downloads necessary to use the tool and the media you utilize in your graphic may be drawn from your own computer or sourced from the web. The website is accessible on either a Mac or a PC.

Getting Started

The first step to creating a ThingLink is adding a background image. This is the image that will always be visible and on which other content will be placed. The image can be selected from folders on your hard drive, imported from Facebook or Flickr, or pulled from any website (just provide the link when prompted).

Next, choose a title for your interactive image and add content. Images, videos, and descriptions are embedded in the image through "tags," little clickable icons that appear when you hover your mouse on the background graphic. To add tags, simply click on the image and a prompt will appear with a menu of icon options, and space to add text. A search bar is available and content may be drawn from Etsy, Amazon, Vimeo, YouTube, and Soundcloud. It is also possible to insert content from other sources—just add the link. The tags you create can be positioned anywhere on the background image and it is possible to rearrange them after you’ve placed them.

At the bottom of the edit screen is a menu for sharing options. Clicking on "Sharing Settings” gives you the option of making your graphic public or unlisted. It is also possible to allow others to access and edit your graphic by adding tags. This function could be useful for collaborative work with students. After your multimedia image is saved it can be shared with others using the “Share” button. The ThingLink can be shared in two ways: the link can be sent directly to others or the interactive graphic can be embedded in another site—class webpages for instance.

Another feature of ThingLink is the “Stream,” It is possible to add other users to your stream and to follow their work. Objects made by other users are also available in the Browse tab. Both of these are useful for inspiration and collaboration.

Examples

There are a multitude of uses for ThingLink—in fact, its biggest feature is its flexibility. Students can work together to create a ThingLink to present research information to classmates. A shared “Stream” enables students and teachers to view each other’s work and edit or add tags as needed.

Another key application may be the aggregation of information that ThingLink enables. In these two examples the image is used to organize information and the tags link to media or provide descriptions or instructions. Tags can also be applied to images to explain classroom tools or content. These static interactive images can be embedded on websites or shared with the class and accessed by inquisitive students at any time.

ThingLink may also be used in class instruction. Students can be asked to interact with an image like this one, which provides a number of examples and in-depth information for the audience. Maps or images may be used to describe locations in greater detail, show relationships, or explain movement through space, as seen here. Another example, here demonstrates how adding tags can be used by an instructor to demonstrate how to access information in texts or give advice on reading and research skills. It may also be useful to break down larger information into bundles or point out structure and other features.

Need inspiration on your ThingLink? Browse the Education Blog to check out Teacher Challenges, webinars, and virtual field trips!

For more information

Looking for base images to use with ThingLink? Lee Ann Ghajar shares reputable places to go hunting.

Crop It

Image
Article Body
What is it?

Crop It is a four-step hands-on learning routine where teachers pose questions and students use paper cropping tools to deeply explore a visual primary source.

Rationale

In our fast-paced daily activities we make sense of thousands of images in just a short glance. Crop It slows the sense-making process down to provide time for students to think. It gives them a way to seek evidence, multiple viewpoints, and a deeper, more detailed, understanding before determining the meaning of a primary source.

Description

This routine helps young students look carefully at a primary source to focus on details and visual information and use these to generate and support ideas. Students use evidence from their “crops” to build an interpretation or make a claim. Crop It can be completed as part of a lesson, and can be used with different kinds of visual sources (for example cropping a work of art, a poem, or a page from a textbook).

Teacher Preparation
  1. Print a collection of primary sources related to the unit or topic under study. The collection may include:
      • various types of sources that include images, such as photographs, cartoons, advertisements, and newspaper articles. Consider images that challenge students to use varying amounts of background knowledge and vocabulary, or that can be read by students working on different reading levels;
      • sources representing different perspectives on the topic;
      • sources depicting the people, places, and events that will be tested in a unit;
      • sources representing perspectives that are missing from the textbook’s account.
  2. Print enough copies so each student can have one source: it’s fine if some students have the same image.
  3. Print and cut out enough Crop It tools so that each student has a set of two tools.
  4. Prepare to display a series of questions either through a PowerPoint presentation or on chart paper.
In the Classroom

Step One: Choose an Image

Ask students to choose a source from the collection that either:

    • connects to an experience that you have had;
    • relates to something that you know a lot about, and/or
    • leaves you with questions.

*Note: other criteria may be substituted such as choose an image that relates to a question you have about the unit, relates to your favorite part of this unit, or that represents the most important topic or idea of this unit.

Step Two: Explore the Image

Crop the image to the part that first caught your eye. Think: Why did you notice this part? Crop to show who or what this image is about. Think: Why is this person or thing important? Crop to a clue that shows where this takes place. Think: What has happened at this place?

  1. Pass out a set of two Crop It tools to each student. Demonstrate how to use the Crop It tools to focus on a particular piece of a source. Students can make various sizes of triangles, rectangles, and lines to “crop” or focus attention on an important part of the source.
  2. Invite students to carefully explore their image by using the tools. Pose a question and ask students to look carefully and “crop” to an answer. For example, ask students to:
  3. (See Question Sets Handout for additional sample questions.) Invite students to revise their answer by choosing another crop that could answer the same question. Encourage students to consider: if they could only have one answer, then which crop would be best? Why? Allow students to look at the crops of other students. Students can explain their crop to a partner. Or ask students to place their source and crop on their desk, and invite students to silently walk around and notice the different types of evidence that students used to answer the same question.

Step Three: Identify the Evidence

Collect the types of evidence students cropped on large chart paper by asking them to recall the different types of details that they cropped. These charts encourage students to notice details and can be used later, when adding descriptions to writing or as supports for answers during class discussions. The charts might look like the example below and will constantly grow as students discover how details help them build meaning. Chart

Step Four: Close the Lesson

Conclude the lesson by asking students what they learned about the topic related to the collection. Ask them to reflect on what they learned about looking at sources, and when in their life they might use the Crop It routine to understand something.

Common Pitfalls

Avoid asking too many questions during Step Two: Explore. Keep the questions and the cropping moving fairly quickly so students stay engaged and focused on their primary source. To increase the amount of thinking for everyone, don’t allow students to share their own crops with a partner or the class right away. Ask students to revise their own crop by trying different ideas before sharing.

Example

See Image Set Handout for samples that you might use with this strategy. These images represent some events key to understanding the Great Depression of the 1930s (e.g., FDR’s inauguration and the Bonus Army’s march on Washington) and could be used to review or preview a unit of study.

For more information

Finding Collections of Primary Sources to Crop

Find Primary Source Sets at the Library of Congress.

See this entry on finding primary sources or search Website Reviews to find useful sources.

Other Resources

Visible Thinking, Project Zero, Harvard Graduate School of Education.

Artful Thinking, Project Zero, Harvard Graduate School of Education.

Richhart, R., Palmer, P., Church, M., & S. Tishman. (April 2006). Thinking Routines: Establishing Patterns in the Thinking Classroom. Paper prepared for the American Educational Research Association.

Bibliography

Crop It was developed by Rhonda Bondie through the Library of Congress Teaching with Primary Sources Northern Virginia.

Glogster

Image
What is it?

Unlike posterboards commonly exhibited in classroom presentations, Glogster allows students (and teachers) to add sounds, videos, and graphics to text and images. These digital posters can then be shared with classmates and teachers via email, posted on class blogs, or simply accessed through the poster's URL address. There is a $5 30 day trial, and educators can also subscribe to an educator's plan that offers a variety of options depending on the specific needs of the course. A "teacher" plan accesses added features and the ability to enroll up to 200 students while a "school" plan allows an unlimited number of enrollees.

Getting Started

Signing up for Glogster (and its educator's plan) is fairly simple and takes only a few minutes. When users click on "create a Glog" they are directed to a sample poster whose elements can be edited and deleted at will.

Although many students can quickly find multimedia sources online, teachers should emphasize that the quality of these images, videos, and sounds will determine the effectiveness of the poster presentation

Before allowing students to begin a Glog, teachers should allow for some time (either at home or at school) for students to gather images, sounds, and video clips into a specific folder and save them on a computer or flash drive. Although many students can quickly find multimedia sources online, teachers should emphasize that the quality of these images, videos, and sounds will determine the effectiveness of the poster presentation. It would also be wise for students to draft the text that will appear on the poster before beginning a Glog. Elementary teachers, especially, should be prepared to assist students in finding sources and saving them in a folder. Students in grades K–3 may struggle with uploading their sources onto the poster but will find that entering text and personalizing the Glog is fairly simple. Once all the images, sounds, and videos are saved onto a folder, students can begin a Glog with either a blank template or by deleting and editing the default poster. To insert files, users have several options. In the top left corner, the "upload" button allows users to select all the files needed for the poster and save them to their Glogster account. Users can also click on the "link" button if they know the URL of their desired media sources. A third option is to simply record a video, audio, or image using the computer's WebCam and/or microphone by clicking on the "grab" button. Each time a file is uploaded a flashing star will appear next to the category in the media toolbox. Users can also upload sources specifically by toolbox category. Editing the poster is fairly simple as well. In order to change the background, select the "wall" tool and choose from the various background designs found in the different categories. The "graphics" tool also allows users to select from various categories, and the animated characters might prove popular with younger ages. Color, font, and size options in the "text" tool help students format the perfect text for the poster presentation. The only tools unavailable under the free education plan are the "data" and "drawing" tools. Once finished, students can save and publish—selecting whether the final product will be publicly visible or kept private. Even if a poster is finalized, it can still undergo editing—a nice feature.

Examples

Effective posters employee a particular theme applied in a consistent manner through the wallpaper design, font selection, and graphics. Teachers and students can begin thinking about glog design by browsing sample glogs from the site's collection of history posters (in the "Education" category).

One particularly effective poster is a cultural history of the Blues, with a rustic style and video samples of two different eras of the genre. Glogs can also be used to post assignments for students, such as this field trip to Cowpens Battlefield. Its novel use of drawing, as well as making each element a link to more expansive page, is noteworthy for demonstrating how Glogs can be given interactive touches.

History teachers will find the quality of Glogster projects will largely depend on instructions, rubrics, and exemplars that all focus on the targeted objectives of the lesson. In other words, what can students accomplish on Glogster that they could not do otherwise? More importantly, how can a digital poster enhance the learning and presentation of history? Answering these questions, and planning well ahead of time, will help teachers and students to maximize the potential of Glogster in the history classroom. In one example of Glogster in action, Amy Trenkle, a DC educator, used glogging to wrap up her 8th-grade class's school year in a unique fashion.

In terms of visual and digital literacy, Glogster can help students apply content knowledge as they create an original product that demonstrates levels of analysis and evaluation. Generating an exciting and thoughtful poster promotes the higher-level thinking teachers seek in the history classroom.

For more information

Google Earth

Image
What is it?

Google Earth uses images obtained from satellite imagery and aerial photography to map the Earth and compliment its Google Maps tool. Users with computers that run Windows XP (and above), Mac OS X 10.5 (and above), and Linux 4.0 (and above) can download the latest version of Google Earth to their desktops for free.

Google Earth's main benefit is its ability to put the world's geographic information in the reach of students and educators, allowing them to manipulate and create their own geography-based visuals to augment historical learning. In the Showcase section, history teachers can browse through products focusing on "U.S. Presidents" or "Historical Imagery" to familiarize themselves with Google Earth.

The Google Earth for Educators site also contains classroom activities that apply geographic concepts in order to better teach history, culture, literature, and other disciplinary areas—perfect for integrating history across many other curriculum areas. This section also provides tips and tricks for using Google Earth as a teaching tool and student work showcase, as well as ideas for how to integrate Google Earth into grant projects. Of particular note is the classroom resources section, which provides a basic overview of how Google Earth can be used by history students and teachers, as well as links to lesson plans. Additionally, teachers can use the forum to discuss with fellow teachers how to use Google Earth in innovative ways.

Getting Started

The first step is to install Google Earth on computers that will be used by students. Teachers should consult with the Instructional Technology specialist at school, or at the school district office, before trying to install Google Earth on school computers.

Examining New Orleans between 2005 to the present helps students understand the destruction of Hurricane Katrina and the recovery efforts that have helped the city prosper once again.

Once installed, it can be easy to become overwhelmed with all the tools available. The historical imagery tool is a good place to begin. Google provides simple and effective web tutorials for each tool, and the tutorial video for historical imagery will help users become familiar with what can they can learn by viewing cities and how they change over time. For example, satellite images of Washington DC, dating back to 1948, reveal the growth of the Smithsonian museums and the national monuments on the Mall. As mentioned in the tutorial video, images of Las Vegas from the last 60 years reveal the city's growth and can open up conversations about urban planning, 20th-century migration to the "Sun Belt," or even Las Vegas's history of gambling and organized crime in the post-Prohibition era. Examining New Orleans between 2005 and the present helps students understand the destruction of Hurricane Katrina and the recovery efforts that have helped the city prosper once again. Another useful feature to explore is the "layers" function. After selecting a location, expand the "layers" menu on the left panel to reveal 10 categories (borders & labels, places, photos, roads, 3D buildings, ocean, weather, gallery, global awareness, and more)—eight of which contain several subcategories. The "gallery" category, in particular, provides educators with a seemingly endless list of possibilities by taking advantage of the resources provided by National Geographic, NASA, New York Times, the Discovery network and many other partners. Displaying layers of streets, landmarks, and photos, for example, would help elementary social studies teachers enrich lessons about the community in the early grades. High school teachers can use these layers to examine military battlefields such as Gettysburg, or urban areas of historical interest such as New York post-9/11. Google Earth also allows users to create new placemarks, polygram shapes, and pathways, and to import images as an overlay. In addition to using the historical imagery tool, users can also select the day/night function to visualize locales at different times of day. Other functions found on the top row include viewing selections in Google Maps, emailing Google Earth images to other people, and printing visualizations. Teachers can use these tools to email students specific geographic visuals ahead of a particular lesson or to print Google Earth images for a handout or worksheet. Finally, the recorded tour feature is helpful for student presentations and projects. Students can prepare their tour by creating historical placemarks and pathways, as well as inserting historical images as overlays. Once all the pieces are in place, they can select the "record a tour" function from the top row of menus. Students can also select layers they would like to be visible, such as the name of roads or photos, and then zoom in to their desired view. At the bottom of the screen a record button will appear to begin recording. If students would like to provide a voice recording for an audio tour, a second button is also available (note: teachers should test any built-in or plug-in microphones beforehand). The "tour" tutorial is a must-see video before working with students on developing their own tour.

Examples

Although it has bot been updated for a few years, Google Earth Lessons has quite a list of ideas on how to use Google Earth and Google Maps in the classroom. One good use for the elementary classroom is to use Google Earth to map out a "Flat Stanley" project. This can be easily modified to a treasure hunt, "where's Waldo?", or other scavenger activities. Both Google Earth and Google Maps allow students to create place marks and pathways that can follow Stanley or Waldo in their travels.

Lesson plans can also make use of geo-mapping tools like Google Earth. In "Slavery, Exploitation, and Slave Trade Routes," a 5th-grade lesson plan guides students in analyzing the slave trade. It includes a structure for developing the final product in Google Maps. From this lesson, students can create an interactive map with placemarks for key areas in the Atlantic slave trade, as well as routes for slave ships and transportation of goods between Africa, Europe, and the Americas. By inserting images that illustrate slave ship conditions and sugar mills in the Caribbean, for example, students can make good use of the tools in Google Earth.

Teachers may want to explore both Google Earth and Google Maps in order to see what each tool offers. Because Google Earth is a bit more complex for younger students and requires installation on computers, teachers may choose to use Google Maps as an alternative tool if they are planning on using basic map functions in their lesson activities.

A gallery of Google Earth products is also available for teachers and students to view and use for brainstorming project ideas.

For more information