Bubbles, Panics, and Crashes: A Century of Financial Crises, 1830s-1930s

Image
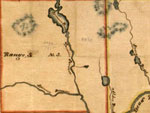
Detail, Somerset County, Maine map, Baker Library Historical Collections
Annotation

One year after the sub-prime mortgage crisis, this website presents a small collection of historical materials and information surrounding four financial crises in the 19th and early 20th century: the Panic of 1837, the Panic of 1873, the Bankers' Panic of 1907, and the Great Crash of 1929. Each section includes a brief explanation of the crisis, including causes and consequences, and between four and six primary sources, including maps, images of bank notes, title deeds, and letters. These sources highlight the complexity of crises and their increasing internationalization over time, as well as issues surrounding historical interpretation of the crises.

The website also includes sections on the Waltham Watch Company, which drew on lessons learned during the Panic of 1937 to mechanize the production of watches; and the real-estate boom of the early 1920s, which has been used recently by economists and historians to better understand current connections between real estate markets and financial crisis. Finally, a bibliography of close to 30 works on the history of these crises, links to manuscript collections, trade publications, and financial databases, give website visitors suggestions for further study.

Sanborn Fire Insurance Maps of South Carolina

Image
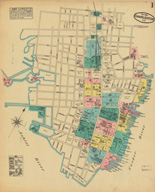
Map, Charleston, May 1884
Annotation

The 580 maps of more than 80 South Carolina towns and cities in this archive reveal urban landscapes and the locations of businesses, mills, colleges, depots, and other buildings between 1884 and 1923. The collection includes 232 unpublished, hand-drafted maps from the years 1899 to 1937. All maps are displayed with original color coding. Users can zoom in and out of maps and can pan right, left, up, or down to examine details. Every map is accompanied by bibliographic data. The full collection can be browsed or the user can choose to browse just the unpublished maps. The collection can be searched by city, year of publication, and county. The maps provide many details about mills and are particularly useful in revealing spatial relationships and location of railroad lines. There is also a link to the Union List of Sanborn and other fire insurance maps. An extremely useful resource for those researching the business or urban history of South Carolina in the decades around 1900.

Integrated Public Use Microdata Series

Image
Logo, Integrated Public Use Microdata Series (IPUMS) USA Logo
Annotation

Currently provides 22 census data samples and 65 million records from 13 federal censuses covering the period 1850-1990. These data "collectively comprise our richest source of quantitative information on long-term changes in the American population." The project has applied uniform codes to previously published and newly created data samples. Rather than offering data in aggregated tabular form, the site offers data on individuals and households, allowing researchers to tailor tabulations to their specific interests. Includes data on fertility, marriage, immigration, internal migration, work, occupational structure, education, ethnicity, and household composition. Offers extensive documentation on procedures used to transform data and includes 13 links to other census-related sites. A complementary project to provide multiple data samples from every country from the 1960s to 2000 is underway. Currently this international series offers information and interpretive essays on Kenya, Vietnam, Mexico, Hungary, and Brazil. Of major importance for those doing serious research in social history, the site will probably be forbidding to novices.

Material History of American Religion Project

Image
Logo, The Material History of American Religion Project
Annotation

In 1996, eight historians of religion and three advisors embarked on a five-year project to illuminate ways that material culture and economic history can be used in the study of American religion, a discipline traditionally dominated by ideas. The site presents annotated photographs of 39 objects, including an evangelical coffee bar, chewing gum packed with biblical verses, artwork in a family Bible, and a church stick used to awaken sleeping congregants. Thirty-eight documents from the 1850s to the 1960s, range from an 1854 book steward report for the African Methodist Episcopal Church to a chain e-mail from the 1990s. The site also includes 23 essays and interviews by the project's participants on such eclectic subjects as "Material Christianity," religious architecture, how Catholic practice has shaped children's experiences, the role of costume in the Salvation Army, how to practice economic history of religion, and "what makes a Jewish home Jewish." Includes eight issues of the project's newsletter; a bibliography of 22 titles; and links to 18 related sites. This site will be especially valuable to university students interested in evaluating the value of material culture scholarship in religious studies, students of economic history curious about applying their discipline to non-traditional fields of inquiry, and scholars within the field of material culture and the broad discipline of American cultural history.

Hagley Digital Archives

Image
Logo, Hagley Digital Archives
Annotation

With a focus on business history and its connections to larger cultural, social, and political trends, the Hagley archive presents digital images on a range of topics, including "industrial processes; commercial landscapes; marketing and advertising; transportation facilities and methods; development of information technology; and, the social and cultural aspects of work and leisure." Pictured are bridges, dams, coalmines, and the testing and manufacturing of gunpowder and explosives, nylon, steel, railroads, automobiles, and airplanes. Also included are images of historic buildings, homes, and gardens in Delaware and Pennsylvania.

There are some images of advertisements, packaging, company brochures, trade catalogs, pamphlets, internal documents, letters, and other ephemera from various industrial enterprises. It includes, for example—under "nylon"—not only shots of machinery, product samples and images of the stages of melting and forming polymers, but also such treasures as ads and publicity shots of women modeling nylon stockings and swimsuits (including "Miss Chemistry" at the 1939 New York World's Fair), and news photos of the riotous early sales of nylon stockings.

Other topics include the early development and use of computers by Univac, IBM, and Remington Rand, aerial photos of the Mid-Atlantic seaboard; automobiles; Lukens Steel Company; ship building; and coal mining.

Economic Data, Fred II

Image
Title graphic, Economic Data
Annotation

Offers statistical national economic and financial data in the following 12 categories: interest rates; business/fiscal (including federal debt, receipts and outlays, employment cost index, productivity and cost, and inventories and sales); consumer price indexes; monetary aggregates; commercial banking; employment and population; gross domestic product and components; producer price indexes; exchange rates, balance of payments and trade data; reserves; and daily/weekly financial data. Much of the data was compiled monthly. Periods covered vary according to category; some statistics go back to 1901. Also provides historical and recent statistics for the states of Arkansas, Illinois, Indiana, Kentucky, Mississippi, Missouri, and Tennessee. Useful for those studying business and economic history, and for social historians interested in employment trends.

Industrial Research and Development Information System

Image
Logo and website graphic (edited), National Science Foundation
Annotation

Provides data from more than 2,500 statistical tables on historical trends in expenditures on research and development (R&D) conducted in the U.S. from 1953-1998 by industrial firms, domestic and foreign-owned. Tables are accessed as downloaded Excel spreadsheets. Data for more recent years, presented under a new coding scheme, can be found in a linked site. Compiled by the National Science Foundation's Annual Survey of Industrial Research and Development. Statistics available include expenditures by industry, size of R&D programs, types of cost, comparison by states, comparison of R&D to net sales by industry, comparison by size of company, federal amounts of R&D, and cost of R&D per scientist and engineer. The site does not contain data for individually specified firms. Provides links to approximately 15 publications and sites on national patterns of R&D resources. Of great value to those studying business history, history of science, and government, in addition to policy makers.

HistoryWired: A Few of Our Favorite Things

Image
Postcard, "Chinese Actor Impersonating a Female Character," San Francisco
Annotation

An experimental presentation of 450 items in the Smithsonian Institution's American History collections, many of which are not on public display. Visitors to this virtual tour will find a map divided into regions representing broad subject categories that contain smaller rectangles standing for individual objects. Moving a mouse to a particular square results in the appearance of the name of the object, a thumbnail image, a date projected onto a timeline, and lines emanating out to relevant subject areas. Users can then click to learn more, finding a 100-200 word description, an option to zoom in closer, and often links to further information in other Smithsonian sites. Also searchable by keyword and category. Objects selected by curators "include famous, unusual, and everyday items with interesting stories to tell. They are not intended to be representative of the Museum's entire collection."

Categories reflect the wide range of the Institution's holdings, including clothing, arts/entertainment, business, science/medicine, photography, home, print/communications, transportation, military, computers, and sports. Includes audio and video items. Users can submit ratings for each object that will affect the future relative size of each square. Although innovative in design, the site may be disappointing to those searching for in-depth information about American history and culture; this is history-lite, with bells and whistles given more prominence than context and meaning.

NBER Macrohistory Database

Image
Logo, NBER
Annotation

This website offers historians a wealth of data on the economic history of the United States. "Data" is the main section of interest to historians. "Business Cycle Dates" in this section offers a listing of the business cycles that have occurred from 1857 to 2001 that show peaks, troughs, and the duration of the contraction, expansion, and the complete cycle. The database located under "NBER Collection" contains 58 reports under the subject headings of macro data, industry data, international trade data, individual data, hospital data, and patent data. The reports have data and statistics on such topics as inflation; social security; vital statistics on births, marriages, divorces, and deaths; manufacturing; industrial production; and the business cycle. Of particular interest under "individual data" are the Vital Statistics of the United States books for the years between 1937 and 1968. There are also links to 37 other collections of economic data. Useful resources for those studying U.S. economic and business history.

Historical Atlas of the Twentieth Century

Image
Map, "1900 Infant Mortality"
Annotation

Through a series of maps of the world, continents, and specific countries, users can trace large-scale demographic, economic, and political trends and developments covering the twentieth century. Topics charted on these maps include changes in agricultural workforce, infant mortality rates, life expectancy, literacy, persons with telephones, systems of government, alliances, borders between countries, and political violence, including wars. While examining any one map, click on buttons to find contextual information from additional maps. The site also includes informative timelines. Created by a librarian, the atlas provides a quick and easy way to see comparative change over time on a worldwide basis. Users should be aware, however, that the categorization scheme does not necessarily reflect the views of professional historians.