Historic USGS Maps of New England

Image
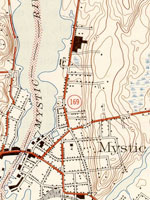
Map, "Mystic, CT-NY-RI Quadrangle," 1944
Annotation

A collection of more than 1,100 topographical maps created by the United States Geological Survey from the 1890s to the 1950s covering all of New England—Maine, New Hampshire, Vermont, Rhode Island, Massachusetts, and Connecticut—and selected areas of New York. The maps—which reveal roads, buildings, rail lines, bodies of water, and elevations—occur in 15-minute and 7.5-minute quadrangle series (a minute is one-sixtieth of a degree of latitude or longitude). In addition, the collection includes six maps with 30-minute quadrangles.

For states other than New York, users can view a state image map and select a point within a grid marked off in 15-minute increments to find listings for available images accompanied by dates the maps were surveyed, created, and revised. Towns within each quadrangle are also listed along with names of adjacent areas. Users also may search an alphabetical list of towns within each state. For New York, only an index of quadrangles names is available. Maps are presented in JPEG format. According to the site, "Each image is typically 2 megabytes, so download times are likely to be slow." A useful site for those studying changes in the New England landscape during the first half of the 20th century.

Osher Map Library

Image
Image for Osher Map Library
Annotation

These 14 exhibitions include more than 600 maps and related documents on aspects of history revealed through the study of maps. The website provides well-integrated essays of up to 8,000 words for each exhibit and some annotated bibliographies.

Exhibits focusing on American history include "Mapping the Republic," on conflicting conceptualizations of the U.S. from 1790 to 1900; "Exodus and Exiles," on Diaspora experiences of Jews and African Americans; "The American Way," a collection of 20th-century road maps and guidebooks; "Carto-Maine-ia," on popular uses of maps; and "Maine Wilderness Transformed," that examines "the creation of a landscape of exploitation."

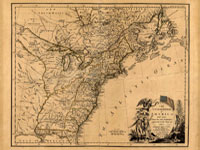
In addition, "The Cartographic Creation of New England," addresses European exploration and settlement, "The 'Percy Map,'" presents a significant Revolutionary War map; and "John Mitchell's Map" offers insight into diplomatic disputes. These maps are especially valuable for studying exploration and cartography in American history.

Abigail Adams Birthplace

Description

The Abigail Adams Birthplace preserves the home in which Abigail Adams (1744-1818), First Lady, was born. Abigail married John Adams, second President of the United States, whom she considered her "dearest friend," in 1764. Adams often looked to his wife for political and intellectual advice and discussion. Abigail Adams promoted women's rights and was a staunch abolitionist. One of her sons, John Quincy Adams, would grow up to become the sixth President.

The site offers tours.

Salem Witch Trials: Documentary Archive and Transcription Project

Image
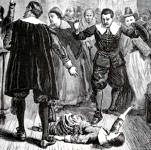
Image, Witchcraft at Salem Village, 1876, Salem Witch Trials
Annotation

This website presents a valuable collection of resources for examining the Salem Witch trials of 1692. There are full-text versions of the three-volume, verbatim Salem Witch trial transcripts, an extensive 17th-century narrative of the trials, and full-text pamphlets and excerpts of sermons by Cotton Mather, Robert Calef, and Thomas Maule. The site also offers four full-text rare books written in the late 17th and early 18th centuries about the witchcraft scare. Descriptions and images of key players in the trials are presented as well.

Access is provided to more than 500 documents from the collections of the Essex County Court Archives and the Essex Institute Collection, and roughly 100 primary documents housed in other archives. There are also seven maps of Salem and nearby villages. Basic information on the history of Salem/Danvers is complemented by eight related images and a brief description of 14 historical sites in Danvers.

Across the Generations: Exploring U.S. History through Family Papers

Image
Photo, Edward Kellogg Dunham, Sr., with daughter Theodora, Wilhelm (?), 1897
Annotation

This collection from one of the nation's leading repositories for sources on women's history features photographs, letters, account books, diaries, legal documents, artwork, and memorabilia generated by four prominent northeastern families from the late 18th through the early 20th centuries. The four families—the Bodmans, Dunhams, Garrisons, and Hales—are white, middle-class families, and their experiences represent only a portion of American society in the 19th and early 20th centuries.

This site features 63 documents and images gathered from the families' papers ,and there are two ways to navigate them: by family or by one of four themes (Family Life, Social Awareness and Reform, Arts and Leisure, and Work). Each family or theme has its own page, with short (350–500 word) interpretive text combined with excerpts from the documents. Each excerpt is accompanied by links to the entire document—both a scanned image and a transcription.

The theme "family life" contains documents that reflect courtship patterns over the 19th century, childrearing practices, and 19th-century gender roles. "Social awareness and reform" features items related to the abolition of slavery and changing perceptions of race, and women's suffrage. Some of the materials within "arts and leisure" reflect increased opportunities for professional women artists in the late 19th and early 20th centuries. The "work" theme includes materials that demonstrate the barriers women faced within the workplace. This site, when supplemented with additional resources, can help show students how to use family papers to study U.S. history.

Martha Ballard

field_image
Spurwink Marsh, Maine, Library of Congress
Question

How would I find more information on Martha Ballard’s religion and other personal information to help me write a better primary source analysis?

Answer

To learn about 18th-century Maine midwife Martha Ballard, first, read Laurel Thatcher Ulrich’s A Midwife’s Tale: The Life of Martha Ballard, Based on Her Diary, 1785-1812 (New York: Vintage, 1991). You could also watch the 1998 PBS video A Midwife’s Tale which comes with a teacher’s guide.

Second, look at the resources collected for the “case study” on Martha Ballard on the Do History website. The website has an archive of some primary sources, including extensive selections from her diary, giving some background and context for Ballard’s religion.

Third, a “Martha Ballard Study Pack,” a study guide for students of A Midwife’s Tale, and a lesson plan for teachers is available from BookRags.

A good website for teachers on the history of Maine with plenty of primary resources is the Maine Historical Society’s Maine Memory Network. Included on that site is Religion on Maine’s Frontier, an online essay with selected images.

If you wish to begin digging into the history of the everyday life of the people of Maine, you should also take a look at the available sources on Maine history and genealogy at Cyndi’s List.

For more information

Valentine Seaman, M.D. The Midwives Monitor, and Mothers Mirror: being three concluding lectures of a course of instruction on Midwifery. New York: Isaac Collins, 1800.

Oxford, Maine, historical information

Contradictions in John Fremont's Political Chart of the US (1856)

field_image
detail of Fremont's chart
Question

The question concerns John Frémont's Political Chart of the United States (1856). Typically, we think of the north as being more industrialized at this point and the south as more agricultural. Yet, under the heading of area on the right of this document the following information is included: No. of farms in slave states – 569,201; No. of farms in free states – 873,678.

That fact from a primary source contradicts what we typically think about the economy of the north and south in the antebellum era. Explain this contradiction. Where were all these farms in the north? Why were there more farms in the north? Was Mr. Frémont referring to small farms?

Answer

The period during which Frémont's chart appeared was one of rapid industrialization and urbanization in the Northeastern states. Economic historian Douglass C. North has identified the 1840s and early 1850s as the era in which "the pace of industrialization accelerated to the degree that the Northeast could unequivocally be called a manufacturing region."

In 1850, urban population in the Northeast accounted for 27 percent of the total population, while the South was only eight percent urban. During the next decade, the South remained predominately rural, with 10 percent of its population living in cities or towns in 1860, while the Northeast continued to urbanize at a swift pace, with an urban population that had grown to 36 percent. Despite the region's growth in industry and urban population, the Northeast retained a large rural population: 73 percent of its total population in 1850 and 64 percent in 1860. Yet, the size of the rural Northeastern population accounts only for part of the answer to the apparent contradiction stated in the question. The seeming paradox can be only resolved if we start by noting the exact language that was used in Frémont's chart.

Fremont's Language

The chart explicitly referred to "free states," not states in the North or Northeast. During this period, the number of farms in the developing area that we now call the Midwest—which with the exception of Missouri was composed solely of free state—increased at a faster pace than in any other region of the nation due to the increasing ability of persons of modest means to purchase newly available, relatively small plots of public land. These new farms tended more and more to be oriented to the market rather than to self-sufficiency. The concurrent rise in urban population in the Northeast was closely related to the growth of agriculture as a commercial enterprise in the Midwest. As cities grew, so did a demand for food that Midwestern farmers supplied. A closer look at the statistics and at the analyses of agricultural and economic historians will help make further sense of the situation.

The number of farms listed on Frémont's chart was derived from the 1850 census (with one small discrepancy—while the chart lists 873,678 farms in free states, the total calculated from the census actually comes to 873,608). According to census figures, New England states (Maine, Vermont, New Hampshire, Massachusetts, Rhode Island, and Connecticut) accounted for 19 percent of the farms in free states, or 167,651 farms; Middle Atlantic free states (New York, Pennsylvania, and New Jersey) totaled 37 percent or 322,103 farms; and the Midwestern free states (Ohio, Indiana, Illinois, Michigan, Wisconsin, and Iowa) 44 percent or 382,982. (The census listed only 872 farms in California, the only state in the far west that had been admitted to the Union by that time.) New York led the free states in number of farms with 170,621. Ohio, the first Midwestern state to be settled, came in second with 143,807. Pennsylvania followed with 127,577, Indiana had 93,896, and Illinois 76,208. In the slave states, Virginia had the most farms with 77,013, followed by Kentucky with 74,777, Tennessee with 72,735, North Carolina with 56,963, Missouri with 54,458, and Georgia with 51,759.

The Business of Agriculture

During the decade of the 1850s, the total number of farms in the U.S. increased by 41 percent, from 1,442,908 to 2,030,785 farms. Nearly half of the new farms were located in the free states of the Midwest. In his classic work of U.S. agricultural history, The Farmer's Age: Agriculture, 1815–1860, Paul W. Gates stated that the "rush for the public domain" during the 1850s "surpassed anything in previous history." Gates attributed the rise in land sales to lower prices and to "[f]rantic railroad building, particularly in the upper Mississippi Valley; the great influx of Germans, Scandinavians, and Easterners into the West; and a new era of banking experiments which greatly increased available credit." Historians have identified this period as part of an "agricultural revolution" that eventually led to the passage of the Homestead Act of 1862, through which homesteading settlers could obtain 160 acres of public land free of charge.

The revolution, which encouraged land speculators in addition to settlers, marked a major shift in agricultural practice in the free states, as "by the 1850s, market-oriented agriculture was firmly established as the dominant approach, clearly distinguishable from the semisubsistence approach," according to agricultural historian Clarence H. Danhof. Economic historian Harold D. Woodman has characterized the "large class of property owners on western lands" during this period as consisting "neither of peasant proprietors nor of yeoman farmers but, rather, of businessmen on the make."

Land Sales

Two visions of the nation's future had dominated early legislative initiatives regarding land sales from the federal government, which under the Articles of Confederation had acquired all state-owned lands west of the Appalachians. Alexander Hamilton and his Federalist followers believed that prices for public land should be set at high levels both to benefit the U.S. treasury and to discourage agriculture in favor of manufacturing endeavors. In contrast, Thomas Jefferson and like-minded politicians, who envisioned a republic of yeoman family farmers, sought low prices for small lots of land that could be purchased on credit by people of average means.

Federalist policy prevailed in early land sales legislation; in 1790, the minimum cost for land purchased from the government was set at $1,280 and the minimum amount sold was set at 640 acres. Due to poor sales, later legislation gradually relaxed maximum and minimum terms, so that by 1820, the minimum price of an acre had dropped from a high of $2 to $1.25 and the minimum amount that could be sold was lowered to 80 acres. In 1832, this amount was reduced further to 40 acres, and by 1854, the minimum price for public land that had remained unsold for more than 30 years was lowered drastically to 12 ½ cents per acre.

The federal government sold nearly 50 million acres between 1850 and 1859. In free states, the number of farms increased by 44 percent to 1,255,518 farms, while those in the slave states increased by 36 percent to 775,267. Midwestern states experienced the highest growth rate in numbers of farms among all regions of the nation. Between 1850 and 1860, the number of farms in the New England states increased by 10 percent, with 16,291 new farms bringing the total to 183,942. Middle Atlantic states increased its number of farms by 18 percent with an additional 58,890 to total 380,993 farms.

Midwestern states (including Minnesota, which had become a state in 1858) increased their number of farms by 74 percent with an additional 283,079 farms to total 666,061, or 53 percent of free state farms. New York, Ohio, and Pennsylvania remained the states with the largest number of farms in the free states (196,990, 179,889, and 156,357, respectively), while Illinois had jumped to fourth place with 143,310 and Indiana increased to 131,826.

The far western states of California and Oregon (admitted to the Union in 1859) with 24,522 farms, accounted for 2 percent of the total number of farms in the free states. The number of farms in southern states in which public lands were sold increased dramatically: by 26 percent in Mississippi, 29 percent in Louisiana, 31 percent in Alabama, 53 percent in Florida, 70 percent in Missouri, 120 percent in Arkansas, and 252 percent in Texas. While the number of farms in the South grew at a greater rate than that of the Northeast, they increased by less than half the rate of Midwestern farms.

Size and Numbers

While the number of farms in the South was less than that of the Northeast and the Midwest combined, the size of farms in slave states was greater on average than those in free states. In 1850, the average-sized farm in the slave states was 318 acres; in the free states, the average size was 128 acres, or 40 percent of the size of an averaged-sized farm in the South. The average size of farms in both free and slave states remained near constant from 1850 to 1860. According to the 1860 census, an average-sized farm in the free states in 1860 was 125 acres, or 3 acres smaller than in 1850, while in the slave states the average acreage had increased from 318 to 319.

Frémont's Midwestern supporters, who put together the chart, were part of a growing movement of farmers who "broke politically with southern planters in the 1850s," according to agriculture and economics professor Willard W. Cochrane. These farmers, Cochrane has written, "came to resist the extension of slavery and the plantation system out of fear of competition from large plantation units based on slave labor with their small family-sized units." In order to survive during the transition to market-oriented farming, they allied themselves more with economic interests in the Northeast than with planters in the South. "The stage was thus set for the realignment of political power, the founding of the Republican party, and the eventual War between the States," Cochrane concluded.
For more information

A detailed copy of the chart, from the Chicago Historical Society, is online at the Lincoln at 200 website.

Bibliography

Agriculture of the United States in 1860: Compiled from the Original Returns of the Eighth Census., under the direction of the Secretary of Interior, by Joseph C. G. Kennedy, Superintendent of Census. Washington: Government Printing Office, 1864.

Jeremy Atack and Fred Bateman, To Their Own Soil: Agriculture in the Antebellum North. Ames: Iowa State University Press, 1987.

Jeremy Atack, Fred Bateman, and William N. Parker, "Northern Agriculture and the Westward Movement," in The Cambridge Economic History of the United States. Vol. II: The Long Nineteenth Century. Edited by Stanley L. Engerman and Robert E. Gallman. Cambridge, UK: Cambridge University Press, 2000.

Willard W. Cochrane, The Development of American Agriculture: A Historical Analysis. 2d Edition. Minneapolis: University of Minnesota Press, 1993.

Clarence H. Danhof, Change in Agriculture: The Northern United States, 1820–1870. Cambridge, Mass.: Harvard University Press, 1969.

Robert E. Gallman, "Commodity Output, 1839–1899," in Trends in the American Economy in the Nineteenth Century. Edited by William N. Parker Princeton, Princeton University Press, 1960.

Paul W. Gates, The Farmer's Age: Agriculture, 1851–1860. New York: Holt, Rinehart and Winston, 1960; reprint, Armonk, NY: M. E. Sharpe, 1989.

Historical Statistics of the United States: Colonial Times to 1970, Bicentennial ed. Washington: U.S. Dept. of Commerce, Bureau of the Census, 1975.

Douglass C. North, The Economic Growth of the United States, 1790–1860. New York: W. W. Norton, 1966.

Harold D. Woodman, "Economy from 1815 to 1865," in Encyclopedia of American Economic History: Studies of the Principal Movements and Ideas. Edited by Glenn Porter. New York: Charles Scribner's Sons, 1980.

Larz Anderson Auto Museum [MA]

Description

The Larz Anderson Auto Museum seeks to increase interest in collector cars and foster community among those interested in antique vehicles. The museum collection includes at least 14 vehicles from before 1930, including an 1899 Winton. Interpretation focuses on the ways in which automobile technology has altered U.S. culture.

The museum offers exhibits, lawn events, guided tours, customizable guided group tours, lesson plans, a play zone, and educational programs for students.

The Modern Civil Rights Movement: A River of Purposeful Anger

Question

Did individual African American activists spark the Civil Rights Movement?

Textbook Excerpt

Textbooks are silent about defining race and racism, even though the modern Civil Rights Movement and its antecedent movements were efforts to challenge and eliminate racism. Rather than addressing the outrage of systematically being denied basic human rights by the U.S. Supreme Court, while citizens in a democracy, textbooks suggest that individual African Americans were merely sad or angry because individual white people did not want to fight wars, play baseball, learn, ride public transportation or eat lunch with them.

Source Excerpt

The most important lessons of the modern Civil Rights Movement will not be gained from passively reading textbooks. Examining primary sources will place students closer to the scenes of the modern Civil Rights Movement and its antecedent movements. Too often Dr. King is represented in textbooks as the person who was sent to save African Americans from racism, or the most powerful leader of the modern Civil Rights Movement, or as a political moderate. Instead, he was one of many powerful leaders.

Historian Excerpt

Textbooks define segregation benignly with little reference to the ways in which northern and southern state governments and businesses systematically – and over the course of several decades -- reinforced an ideology of white supremacy through violence. Other groups of people affected by these same laws and practices – including American Indians, Mexican Americans, Asian Americans and Pacific Islanders, Native Hawaiians, Native Alaskans, Jews and Arabs – are seldom included in textbook discussions of racism. These absences strip away the underlying motivation for collective anger and social action.

Abstract

Textbooks present the modern Civil Rights Movement in the same way as other U.S. social movements -- a spontaneous, emotional eruption of saintly activists led by two or three inspired orators in response to momentary aberrations in the exercise of democracy. In particular, textbooks imply that, until World War II, African Americans had been relatively content with social, economic, and political conditions in the U.S. Then, suddenly, African Americans were angered that they could not fight on battlefields, play baseball, attend schools, or sit on buses with whites. Further, African Americans were the only people to observe and protest these conditions. Finally, to act on their discontent, African Americans required instructions from a benevolent federal government, or a single charismatic or sympathetic leader. A more accurate telling of the story of the modern Civil Rights Movement indicates that the “river of purposeful anger” has been long, wide and well populated.

The modern Civil Rights Movement is often marked as beginning with the 1954 U.S. Supreme Court decision banning school segregation or the day in 1955 when Rosa Parks refused to move from a bus seat in Montgomery, AL and ends with the passage of the 1965 Voting Rights Act or with the assassination of Dr. Martin Luther King, Jr. in 1968 (Or, more recently, with the election of President Barack Obama). In some textbooks, the context for this movement are the years following the 1896 U.S. Supreme Court case of Plessy V.